Effective basemaps
What is a basemap?
Often referred to as a contextual or backdrop map, a basemap contains reference information used to both orient the viewer and add context to any data that is overlaid. Basemaps come in a variety of types, styles, and scales, from full detail to muted ‘background’ styles.
What are the options?
When it comes to choosing a basemap there are many choices available, from creating your own to using a provided service. Let’s look in more detail at some of these options:
Raster maps
Raster maps are images made up of pixels. The content is set and the scale and style are predefined however it is possible to make minor alterations to the look and feel of them. If you’re using a raster basemap then it’s often a good idea to desaturate the colours, reduce the opacity or even convert it to greyscale. This will help your overlays stand out more clearly.
If used at the wrong scale then you will end up with an illegible map so they’re better suited to static mapping where the scale is set.
Vector maps
Vector data enables us to have full control over the content and style of our map. It also allows us to create maps over multiple resolutions that are smooth and seamless. This type of data is preferable when you’re creating dynamic web maps.
Not only can you control the look and feel of your map but you can control the content – selecting only the features that are relevant for your requirements. This allows us to reduce clutter and design clear, effective cartography.
Web Map Services
There are many mapping services available that let you quickly and easily include a basemap in your application (be that desktop software or online). These are available in myriad styles with different levels of information.
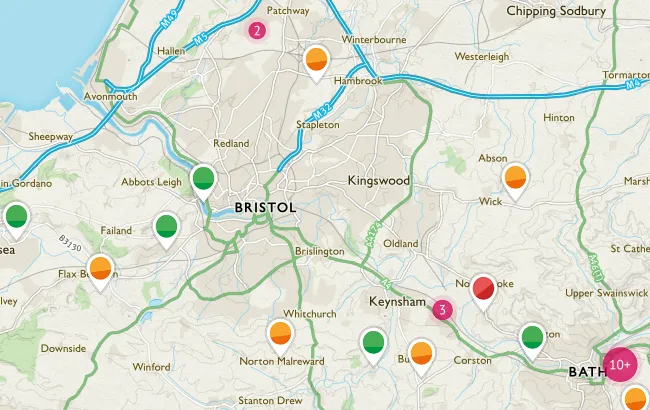
If you have used OS Maps then you will be familiar with the map options – these are all being streamed via the internet. Via the app you also have the option to download them onto your device for offline use.
We have a range of web map services that you can use in your own application or GIS, including OS Maps API.
The OS range of basemap styles
We have created four house styles for our basemaps.
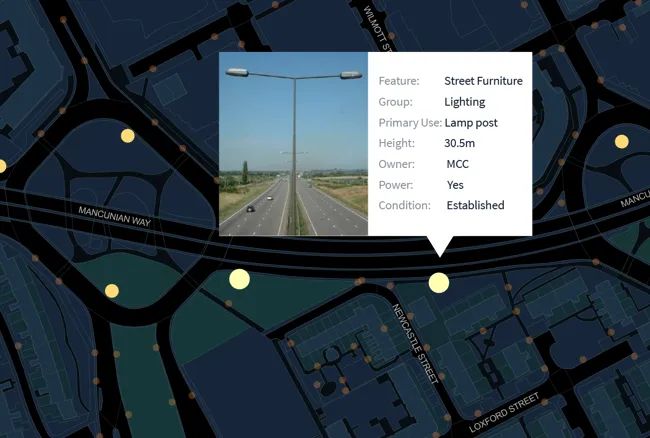
Road: A familiar style with a focus on transport networks – specifically highlighting the Great British road network. High in contrast with lots of detail and colour, this style will fit many uses and satisfy those who are familiar with traditional OS maps.
Outdoor: Designed for outdoor leisure and used within our OS Maps desktop and mobile application. Borrowing certain design elements from our traditional paper maps this style focuses on terrain and land cover, has a minimal colour palette and contains familiar symbology.
Light: Designed specifically for data visualisation, this style has a subtle palette and is simple and clear. Use it to add geographic context and make your own data shine.
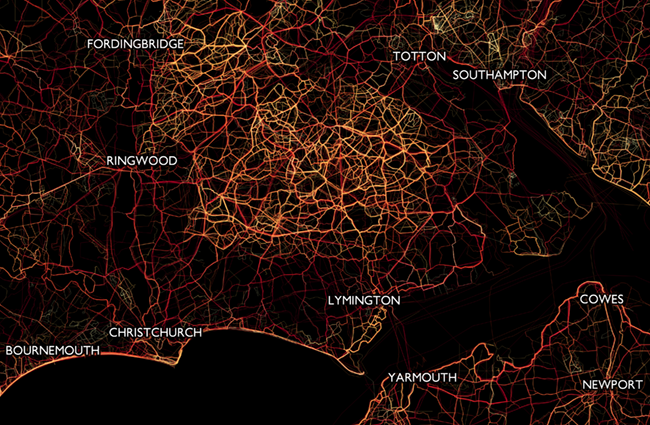
Night: Night mode mapping that’s great in dark environments. It’s at its best on a mobile device, and the dark pixels can help save your battery. See your own data really pop using this style.
These basemap styles are part of our GeoDataViz Toolkit where we share all the colour values – learn more about how you can use them here.
A few tips for designing your own basemap
Visual hierarchy is key! Always keep in mind that the basemap should recede into the background and your data overlays should stand out and be the main focus of the map. There are various ways to achieve this. When designing your basemap:
- Use light (or desaturated) colours
- Often less is more – choose the content wisely
- Change the opacity of rasters (or convert them to greyscale)
- Cooler hues tend to recede into the background
Keep it simple – if it’s not adding value then it’s adding clutter (or chart junk) so remove it!
Make sure your map is legible. Critique your own work and ask yourself; Can I read the text? Can I easily distinguish between the different features?
If you want to be bold then go for a dark colour palette. To achieve maximum contrast you can design a dark basemap over which you can overlay bright colours to really make your data stand out. This is an aesthetic that we have become more familiar with over recent years and this technique can really grab a viewers attention.
Designing your overlays
If you’re using a basemap then the likelihood is that you’re overlaying some additional data. The design of this data is important as you want it to stand out, be legible and easy for your users to understand. In our toolkit we’re sharing colours and symbols that can help you style your overlays and you can look at our visual deconstructions for ideas and inspiration.
Why not make a sandwich?
In this post we have discussed how to use basemaps effectively. There is a good argument to be made that says ‘maps are data so why treat the basemap separately?’
If we apply this logic then the design of our “contextual” and “overlay” data should be mutually inclusive. Our data of interest (or thematic layer) doesn’t have to necessarily be overlaid – it can be treated like all the other layers in the map. To this end we can make a map sandwich where our data of interest is sandwiched in between other layers.
A good example of this that we often see is in the design of choropleth maps where the text labels and/or roads will be placed over the top of the thematic layer.
Summary
As you can see, there are many options available to us and many decisions that need to be made to ensure that we’re using the right basemap and designing effective visualisations. A good base map not only supports but enhances your information and therefore improves the user experience of your map. Choosing the wrong basemap can detract from your data, resulting in ineffective communication and potentially misleading messages.
Access our GeoDataViz Toolkit
In this repository, you'll find resources, assets and other useful links.
Sharing the latest news about OS. We can license you to use OS maps in print, online and film format. For more information and resources for journalists, bloggers and media professionals, email pressoffice@os.uk or call 023 8005 5565.
Products and solutions featured in this blog
OS Maps API
Accurate, up-to-date maps that offer the most convenient way to add detailed OS data to your application.
