Developing geospatial skills for Data Scientists
Jobs in data science are some of the fastest-growing, most in-demand roles in technology
As data scientists are now playing a critical role in organisations across the private and public sector, Ordnance Survey (OS) want to ensure that the use of geospatial data is an integral part of the data science tool kit.
In June 2022 OS was delighted to support the Office of National Statistics (ONS) Data Science Graduate Programme. The programme, run by the Data Science Campus, offers an opportunity for graduates to start a career in data science and develop their passion for data, as well as providing an opportunity to work at the heart of data science in the public sector with experienced teams of data scientists who are already making real world impact through their work.
The Geospatial Module
The new geospatial module, titled Geography for Data Science and Analysis, was delivered over three days to the first cohort of graduates enrolled on the Public Sector Data Science Graduate Programme. Joining the programme were participants from a number of different Government departments including HM Land Registry, HM Revenue and Customs, Ministry of Defence, and Welsh Government.
Experts from OS collaborated with colleagues from ONS to deliver an introduction to geospatial data. This covered areas from access and acquisition through to data visualisation and practical applications, including examples of where geospatial data is delivering real world impact.
The module aimed to build geospatial capabilities and equip participants with the necessary know-how to work with OS data and how to integrate this into other systems and tools.
Steve Kingston, OS Senior Data Scientist, who delivered the module, said:
“It was great to be part of the first Geospatial Data module and build on OS’s strong relationship with ONS. The module allowed the OS team to share our know-how and experiences in working with geospatial data across the public and private sector.
“As a data scientist I have seen first-hand how location data can help tackle challenges and make sense of complex data and information. By linking and integrating statistics, social economic data and people to place can help generate amazing insights. This really demonstrates the power of place.”
The course covered both the theory and practical application of geospatial data science for insight generation touching on:
- The Public Sector Geospatial Agreement (PSGA)
- Accessing OS data through the OS Data Hub and API’s
- Geospatial data visualisation theory and best practice including thematic mapping applications
- The Python and R toolkits for geospatial data analysis and visualisation
- Repeatable analytical pipelines
- Geospatial-statistical integration – combining people and place through OS and ONS data
Steve added: “Some participants were exploring geospatial data for the first time, and it was vital that we made the module enjoyable and hands on. We wanted to put theory into practice to get people thinking about applying geospatial to their organisations and challenges.
“Data scientists can create impressive results for their organisation, and we hope that the use of location becomes an adopted skillset. In the last year we have seen OS data and expertise provide real value to several critical national projects. From supporting the Covid-19 response with data visualisations and insight to helping locate the best locations for future EV infrastructures.”
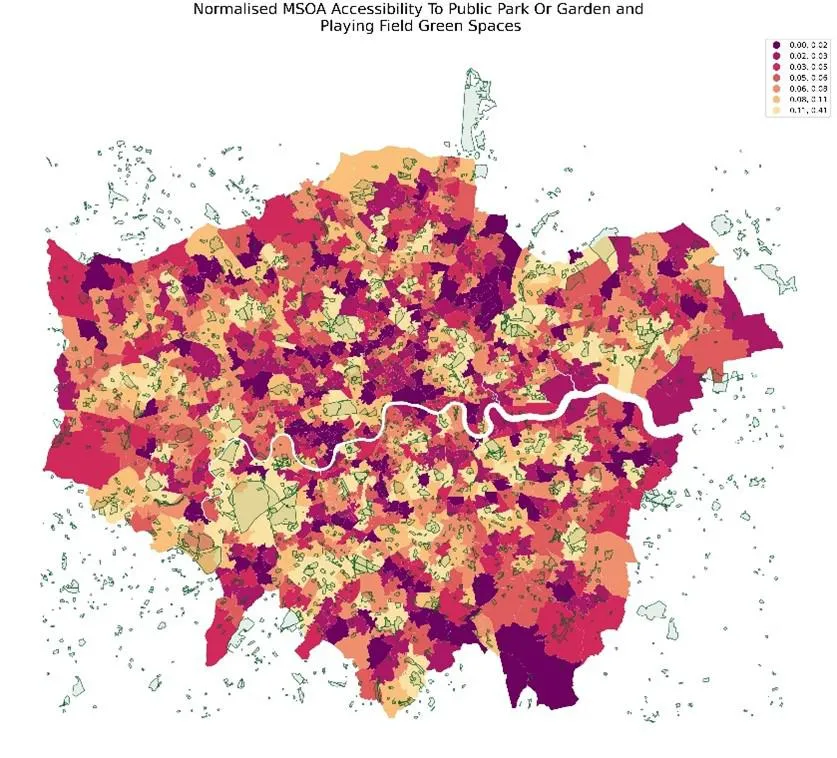
Accessibility to green spaces
One of the practical exercises covered in the module was a data visualisation exercise using OS Greenspace data and ONS MSOA (middle super output area) data to determine access to greenspaces in each MSOA of London.
Delegates on the graduate training module ran distance analysis using Python or R to determine the greenspaces. To visualise the analytical output information, they considered the relative merits of different thematic mapping techniques and decided on the most suitable one.
In this case a choropleth map (a map that uses different colours or shading) was used which allows the information relating to the individual MSOA boundaries to be illustrated with a colour scale, from most (darkest) to least (lightest).
This is a great example of multiple visualisation and analysis tools being used together to convey the message of a geospatial dataset. Without visualising the data in this way, it would be much harder to identify trends and understand the spatial element of this information.
Work has already started on next year’s programme and OS will be returning to deliver the Geospatial Data Module. For more information on the programme visit the Data Science Campus Website.

Our highly accurate geospatial data and printed maps help individuals, governments and companies to understand the world, both in Britain and overseas.