Dynamic hillshade: create realistic terrain visualisations using OS Open Zoomstack
Inspired by the Mapbox blog – Tim Manners in our OS Labs team built this awesome demo application to showcase the dynamic hillshade. The demo includes a widget which enables you to change the light source directly on the client and see the map change in real-time. Tim used our OS Terrain 50 DTM grid dataset to generate a series of Terrain-RGB tiles. These tiles contain elevation data encoded in raster PNG tiles as colour values that can be decoded to raw heights in metres and rendered on the client-side for customisable terrain visualisations. Take a look below for how it appears when combined this with the OS Open Zoomstack Vector Tile API.
Want to make your own?
To generate the Terrain-RGB tileset – OS Labs used GDAL (Geospatial Data Abstraction Library) to combine/warp the individual ASCII tiles into a single Web Mercator projected GeoTIFF; before using the rio-rgbify command line tool to create the Terrain-RGB encoded MBTiles.
If you would like to do this yourself, Tim has created a ‘how to guide’ for generating your own Terrain-RGB tiles which you can find here.
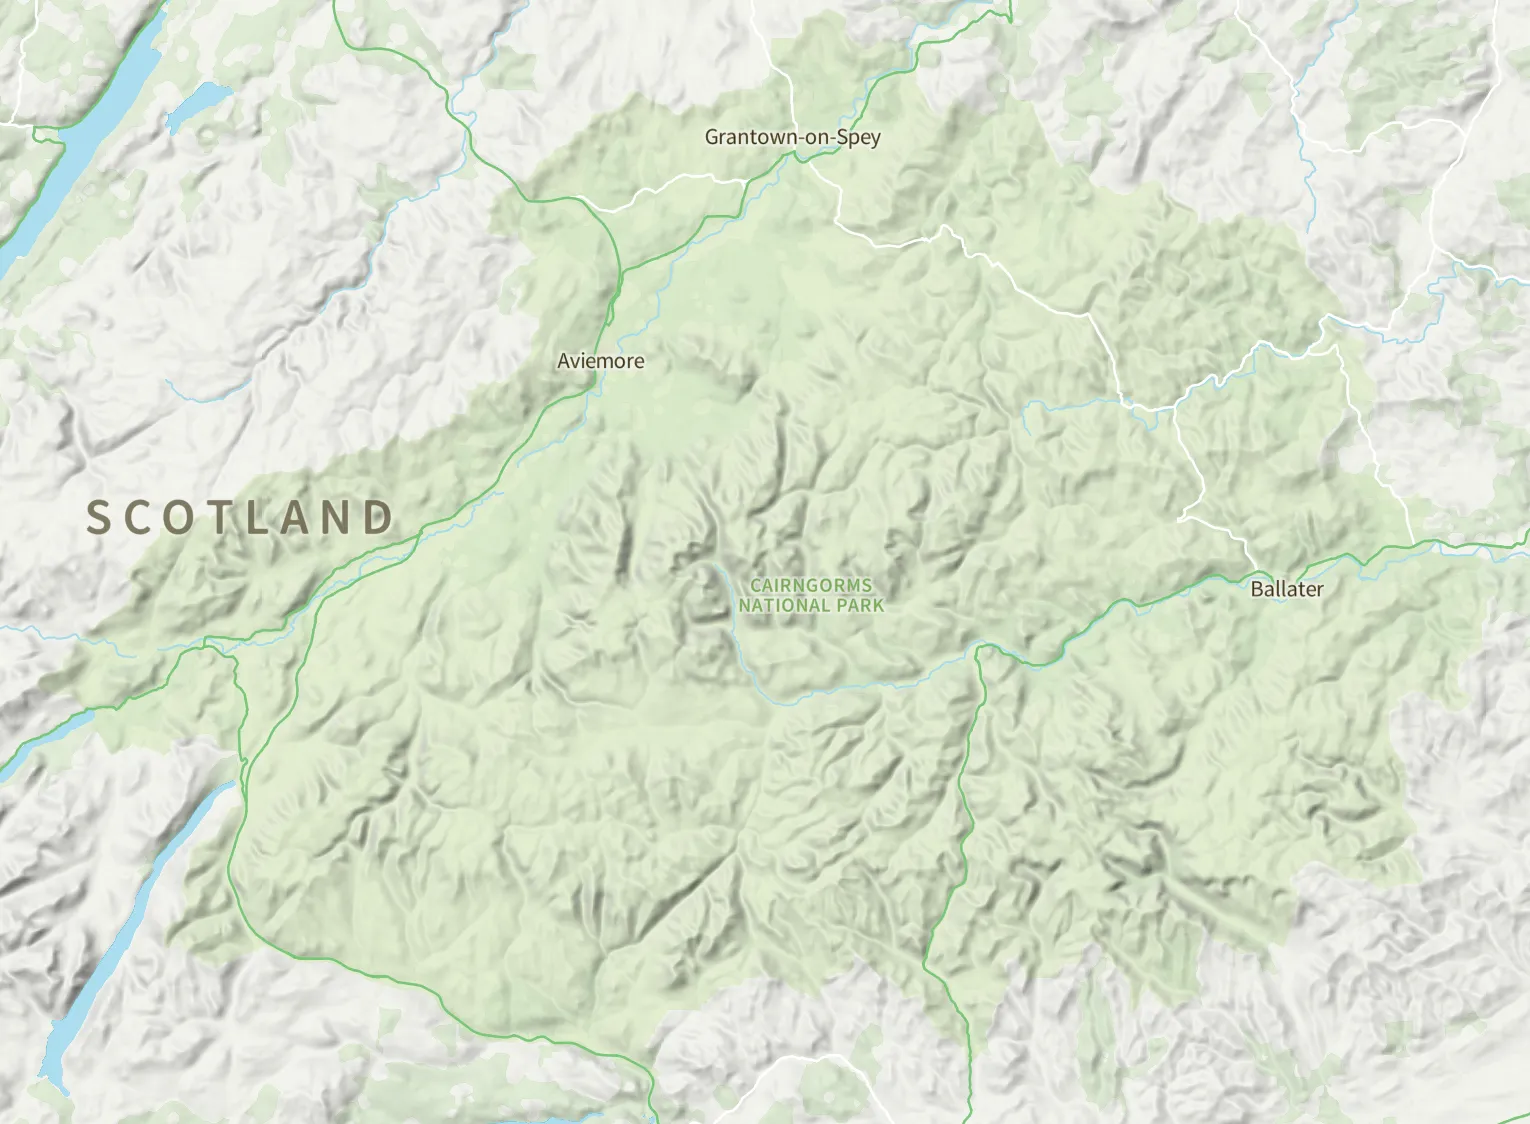
Hillshades can add a realistic impression of terrain to your maps and are often easier to interpret than contours – although a combination of both is often favourable. Here’s a great example of how the hillshade layer can add texture and depth to OS Open Zoomstack:
OS Open Zoomstack trial update
We are now seven weeks into our trial and as we reported last month, we’ve been overwhelmed with the positive feedback, which continues to come in. The GeoPackage and Vector Tiles have been well-received and we’re starting to see people integrate the new data into their applications – we’ll be sharing more examples soon.
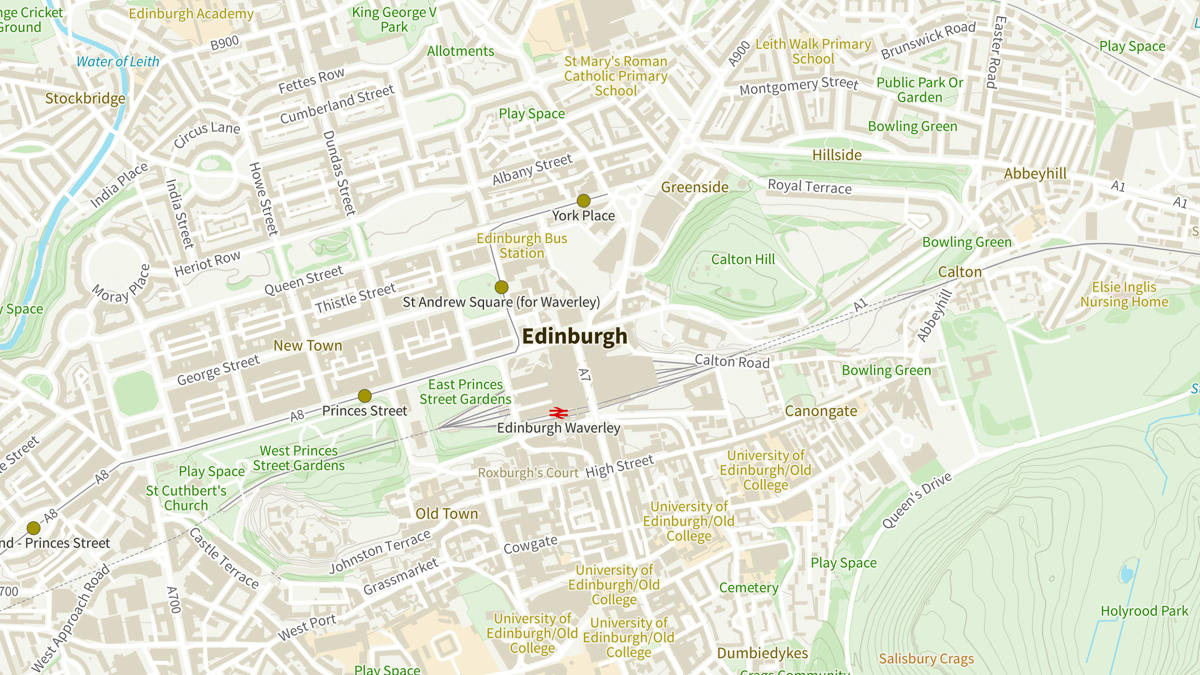
"I’ve spent the day making maps in and around #Edinburgh with the fantastic @OrdnanceSurvey #Zoomstack. The way the dataset scales from city centre to east coast of Scotland is amazing. The #Geopackage makes it so easy. Enjoy the Disco Zoomstack gif #geodataviz #GIS #mapping pic.twitter.com/SV6xJA3AUY"
— Dave G 🏴 (@akaDaveG) August 20, 2018
“Put very simply, it’s a giant, beautifully styled vector dataset for the whole of Great Britain. It can be used in a webmap…in a desktop GIS…and other ways.” @undertheraedar on our OS Open #Zoomstack trial – read more and try it yourself https://t.co/ej05OATLhH #opendata pic.twitter.com/TQCOlCEuBz
— Ordnance Survey (@OrdnanceSurvey) August 20, 2018
As well as the Dynamic Hillshade demo above, we use OS Open Zoomstack in many of our own applications and product demonstrators. One of our recent work experience students also used it to good effect. Elsa created an interactive story map highlighting the archaeological sites of Dartmoor and she said, “Being able to create something using completely unfamiliar software in a very short amount of time was really exciting…and to get an insight into how GIS software can be used to present data in creative ways.”
Explore OS Data
Learn about the geospatial data you can get and the plans available
Our data platform provides access to all Ordnance Survey datasets through a suite of APIs and data downloads.

Our highly accurate geospatial data and printed maps help individuals, governments and companies to understand the world, both in Britain and overseas.
Products and solutions featured in this blog
OS Open Zoomstack
Ordnance Survey's OS Open Zoomstack is an open vector basemap showing coverage of Great Britain from a national level, right down to street detail.