Britain's cities are getting hotter and trapping heat they can no longer release
OS analysis reveals where urban heat islands could intensify most this century
Press Office
Urban heat islands form where dense buildings, roads and hard surfaces absorb solar heat during the day, keeping cities significantly warmer than surrounding countryside. Unlike rural areas, which cool rapidly after sunset, cities retain the same heat overnight. Tall buildings and narrow streets reduce wind speeds that would otherwise carry heat away, while a lack of trees and water sources eliminate the natural cooling effects of shading and evaporation. Where cities lack sufficient green and blue space to moderate temperatures, this effect intensifies throughout both day and night.
Drawing on its detailed mapping of Britain's built and natural environment, OS analysed data including building density and height, hard surface coverage, tree canopy, open vegetation and water across every city in England, Scotland and Wales. OS combined this with satellite readings on observed land surface temperatures compared to their surrounding natural environments from 4 Earth Intelligence, and Met Office climate modelling air temperature projections to produce a Heat Vulnerability Index tracking how each city's heat exposure is projected to evolve through to the end of the century, and how effective current sources of natural cooling are in releasing extreme retained heat.
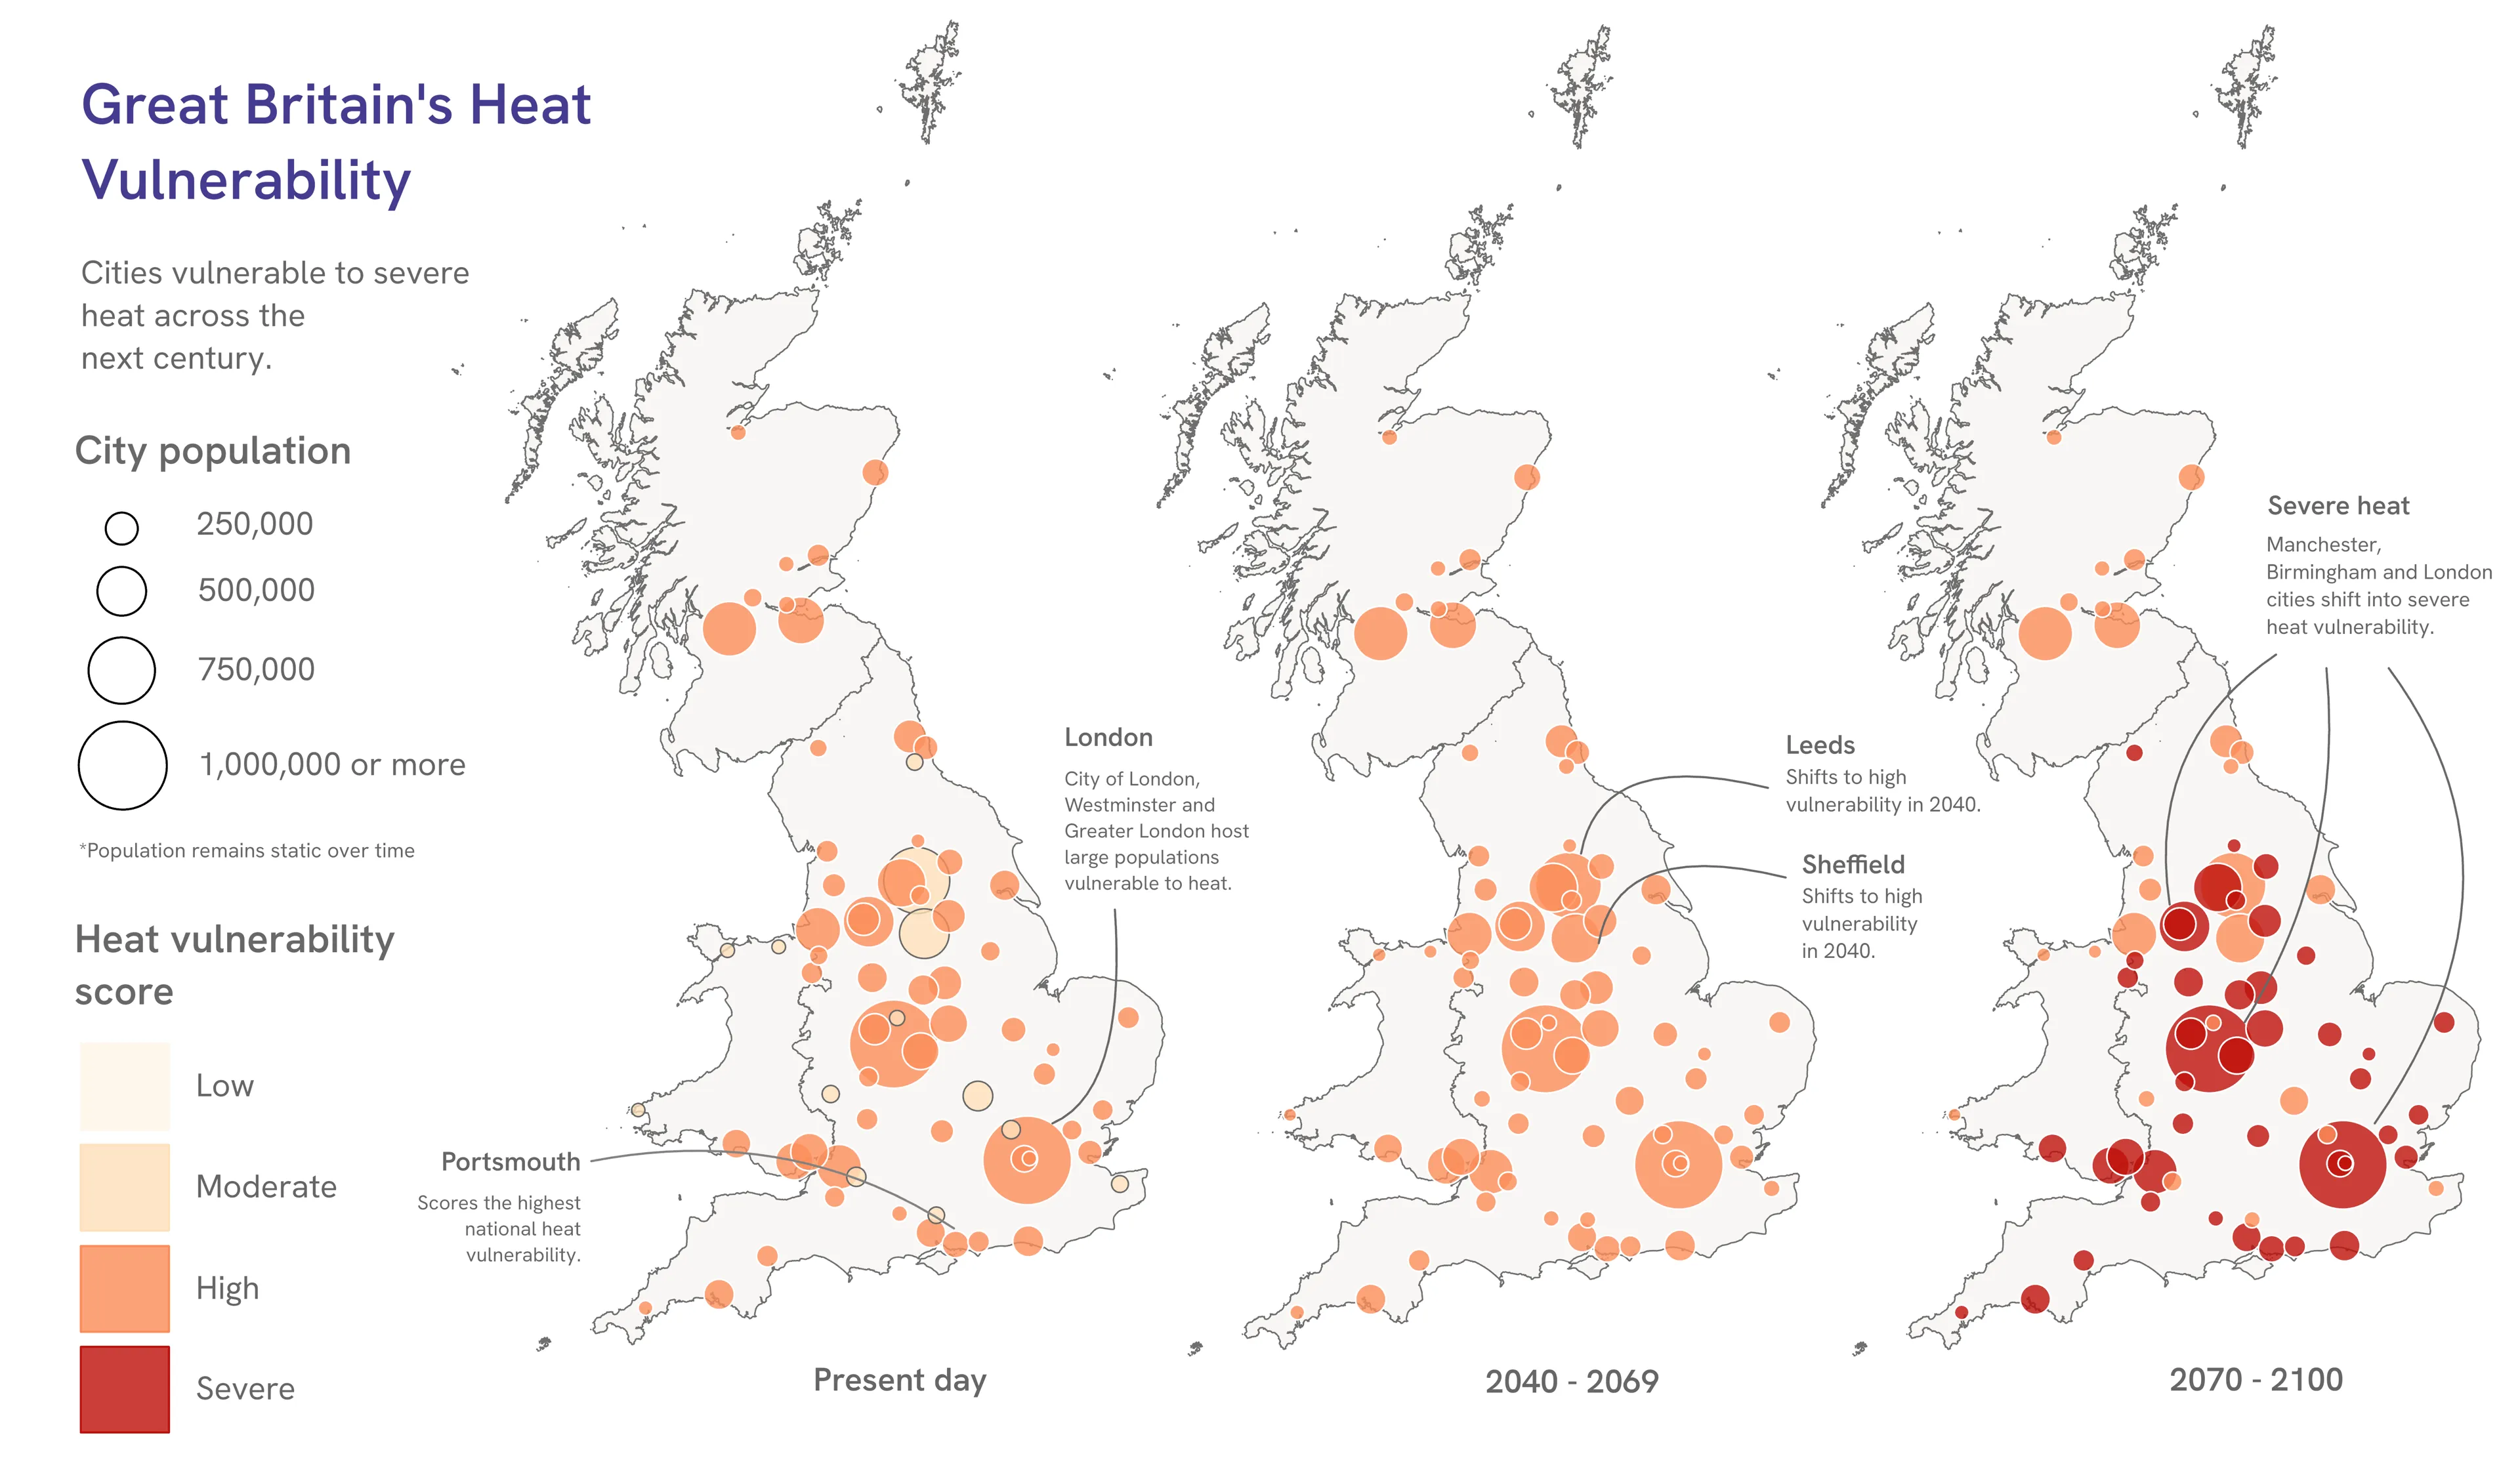
OS analysis finds that 83% of Britain's cities (59 cities) are already highly vulnerable to urban heat, with the remaining 17% (12 cities) classed as moderately vulnerable today. By 2040, rising summer temperatures are projected to push every city into the high vulnerability category, and by the turn of the century 63% (45 cities) are set to cross into severe heat vulnerability, the most serious level in the Index.
Within the ten most vulnerable cities today, Leicester is projected to see the biggest rise in Britain's heat vulnerability rankings, climbing from 10th today to fourth by the end of the century. Exeter and Nottingham also rise the rankings to enter the top ten most heat vulnerable cities, alongside Bristol and Brighton and Hove, as rising temperatures reshape the geography of urban heat vulnerability across Britain.
The consequences extend far beyond uncomfortable summer days. Urban heat can increase risks to health, particularly for older and vulnerable people, while putting additional pressure on homes, workplaces, transport, energy infrastructure and public services.
Table 1: Number of Britain's cities by heat vulnerability category from present to 2100:
|
OS: Heat vulnerability category |
Present day |
Near term (2040 to 2069) |
Long term (2070 to 2100) |
|---|---|---|---|
|
Severe (4 to 5) |
0 |
0 |
45 |
|
High (3 to 4) |
59 |
71 |
26 |
|
Moderate (2 to 3) |
12 |
0 |
0 |
Based on the OS Heat Vulnerability Index scoring across 71 GB cities.
"These findings matter because cities are where millions of people live, work and spend their everyday lives. Extreme and sustained heat can affect people’s health and wellbeing, how comfortable our homes and workplaces are, and put additional pressure on transport, energy and emergency services. The OS Heat Vulnerability Index shows that by 2040, every city in Great Britain is projected to reach high vulnerability, and by the turn of the century, almost two-thirds could reach the most severe level. Understanding how and where this vulnerability is changing depends on an accurate view of how the country is built, based on trusted authoritative data, which is critical for planners, developers and local authorities preparing for a warmer future."
What makes a city vulnerable to urban heat
To understand what is driving these differences between cities, the OS Heat Vulnerability Index combines current observed temperatures with the structural characteristics of Britain's built environment and forward-looking climate projections. It produces a score for every city on a scale of 1 to 5, where 3 to 4 is high and 4 to 5 is severe.
The Index is built from four components: a temperature score derived from 4 Earth Intelligence satellite data on heat hazard risks of observed land surfaces compared to their surrounding natural environments; a climate change score from Met Office UKCP18 climate modelling air temperature projections; a built environment score measuring building density, height, connectivity and hard surface coverage from the OS National Geographic Database (OS NGD); and a natural cooling score measuring tree canopy, open vegetation and water bodies, also from the OS NGD. The full methodology is set out in the notes to editors.
While every city is projected to see its heat vulnerability increase over the coming decades, this analysis reveals significant variation in the structural factors driving this across Great Britain, illustrated by three cities at different points on the Index.
London: Britain's most heat-retentive urban environment
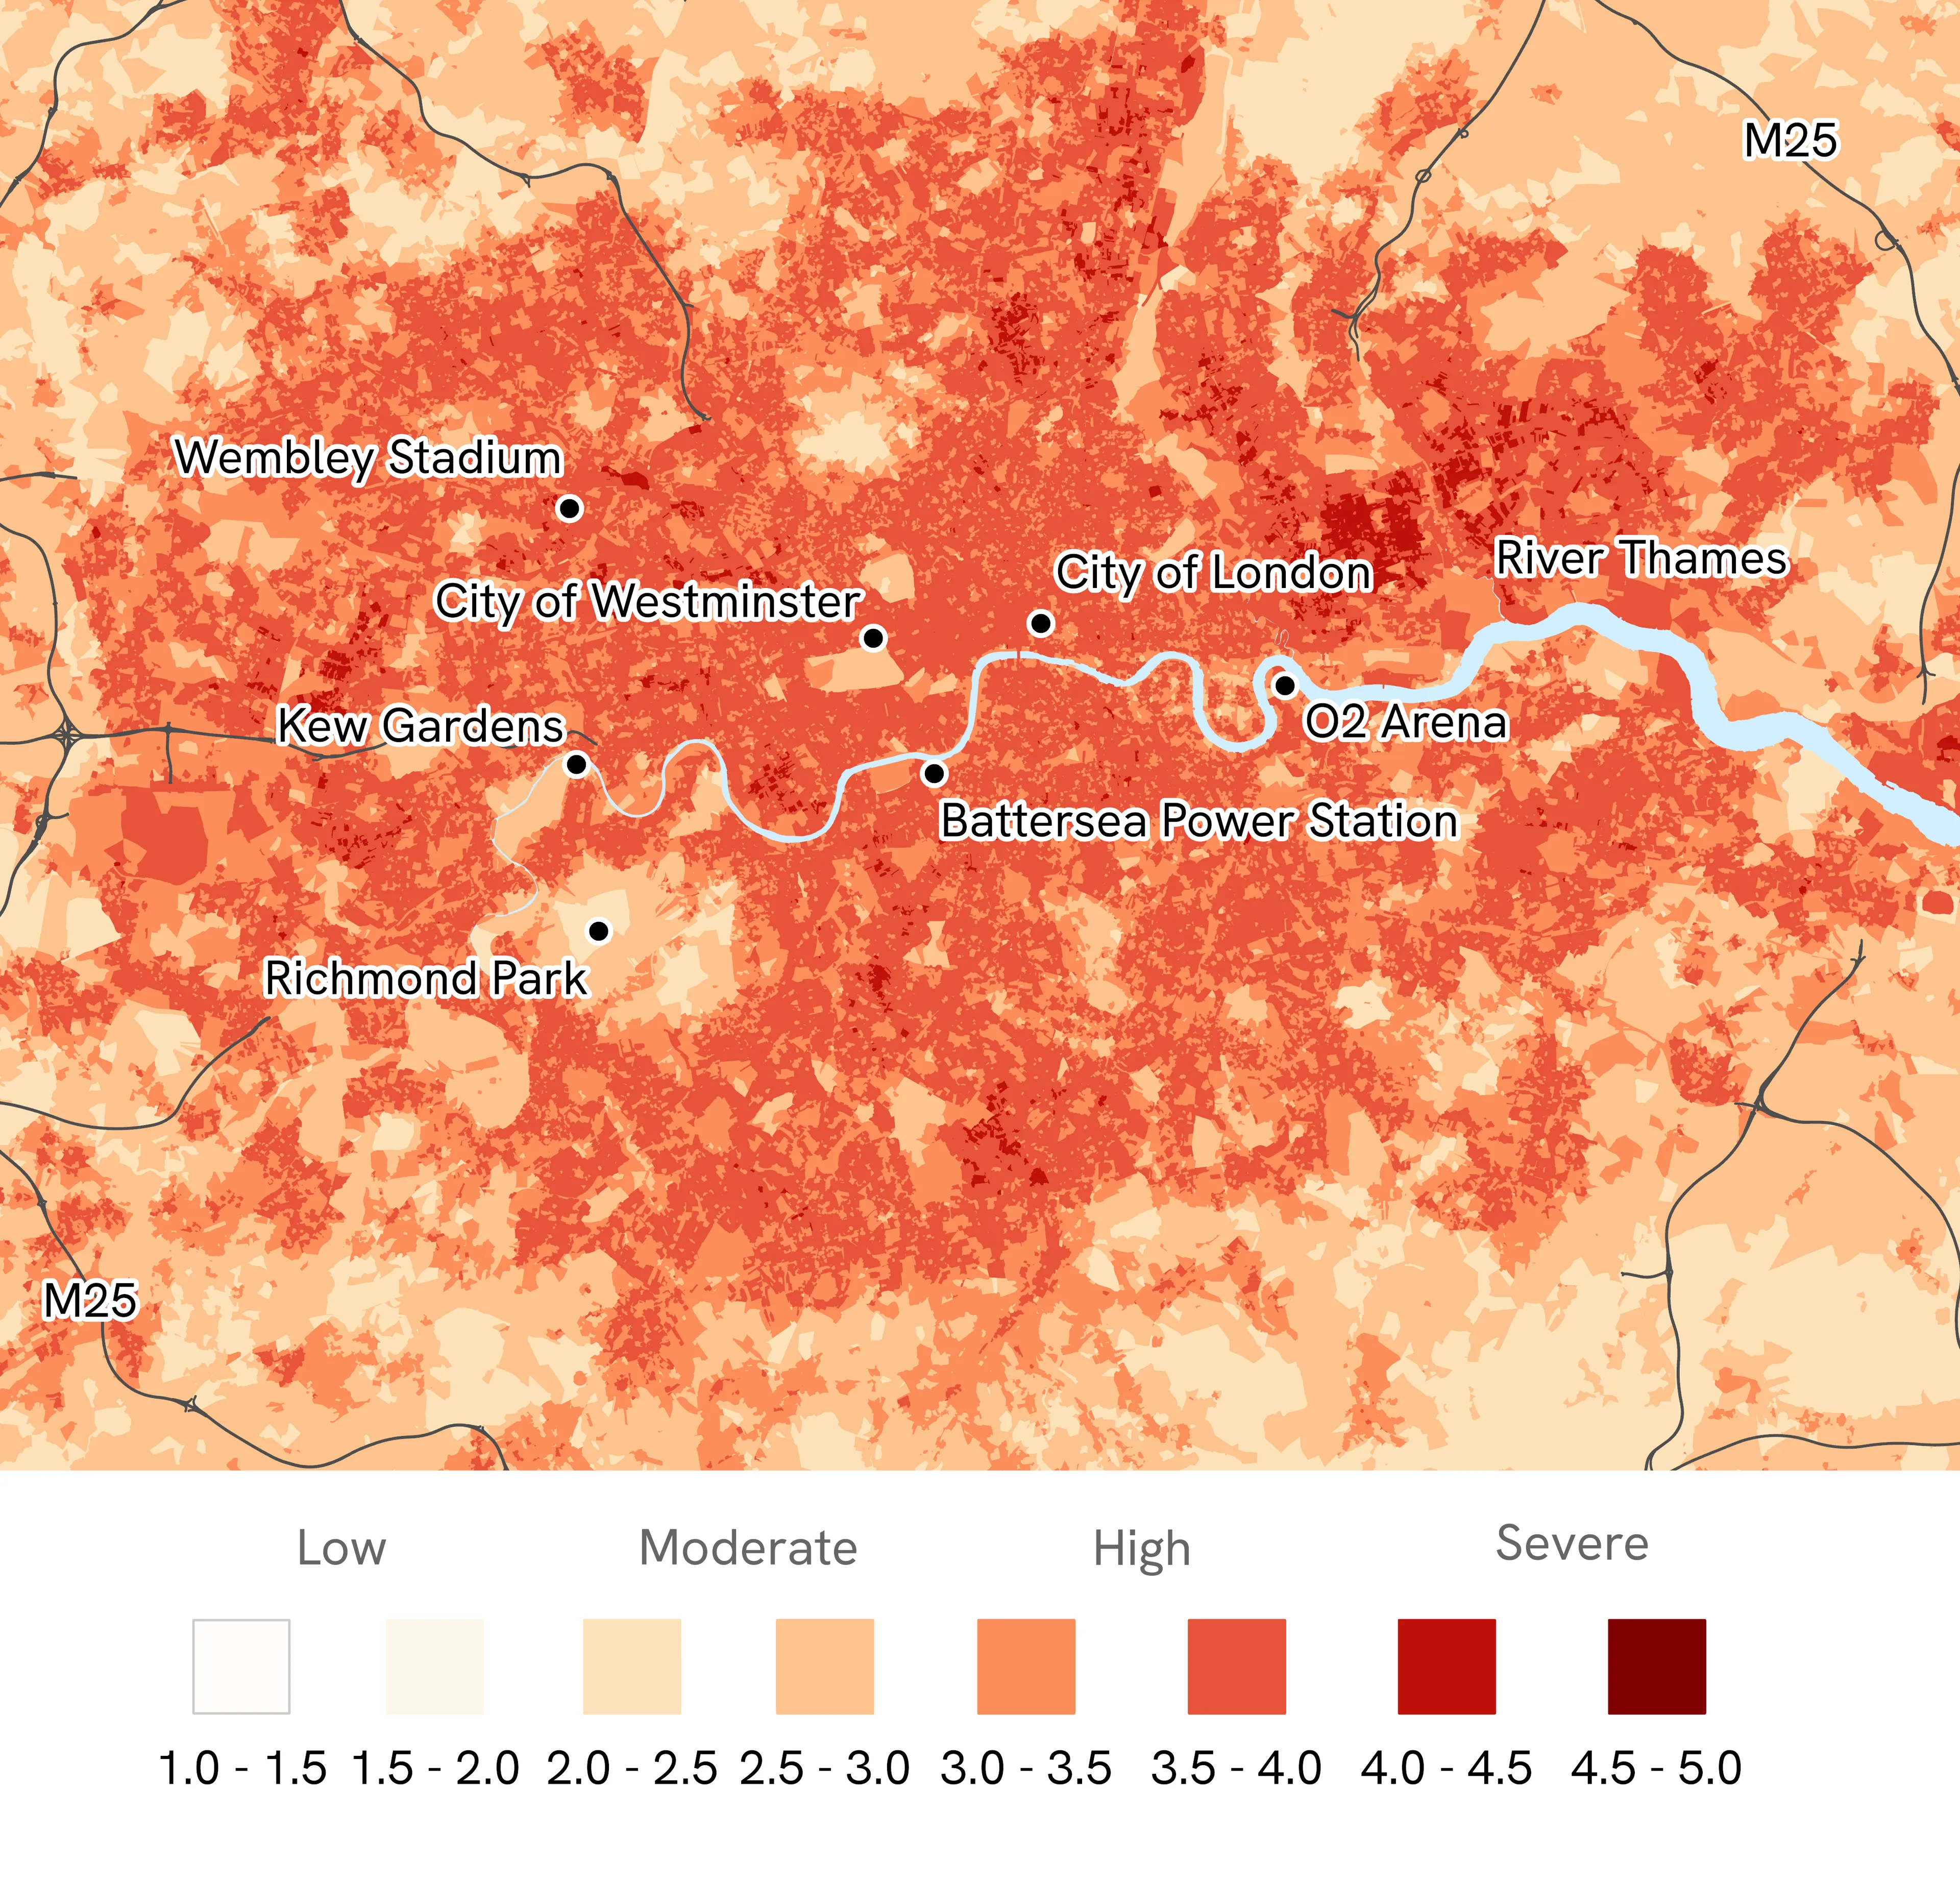
The City of London and City of Westminster, the two densely built inner-city areas at the heart of Greater London, rank among the most heat-retentive urban environments in Great Britain. The City of London records the highest built-environment score and the least effective natural cooling of any city, with its concentration of buildings, roads and made surfaces combined with limited green space, trees and water. Westminster follows closely, ranking second on both measures, ranks third for overall heat vulnerability today and second in both future periods.
Heatwaves alone have contributed to an estimated total of 2,877 heat-associated deaths in May and June this year, and the impacts of urban heat islands in London are already being felt. Research published in The Lancet Planetary Health in 2025 found that approximately 399 of the 785 heat-related deaths in Greater London during the summer of 2018 were attributable specifically to the urban heat island effect rather than background temperatures alone, with a social cost estimated at up to £987 million. A separate study commissioned in support of Heat Ready London, the Mayor of London's heat resilience initiative, estimated the total economic cost of the 2022 London heatwaves at £1.5bn, spanning productivity losses, health impacts, education disruption, energy demand, transport and emergency services.
Portsmouth: Britain's most heat vulnerable city
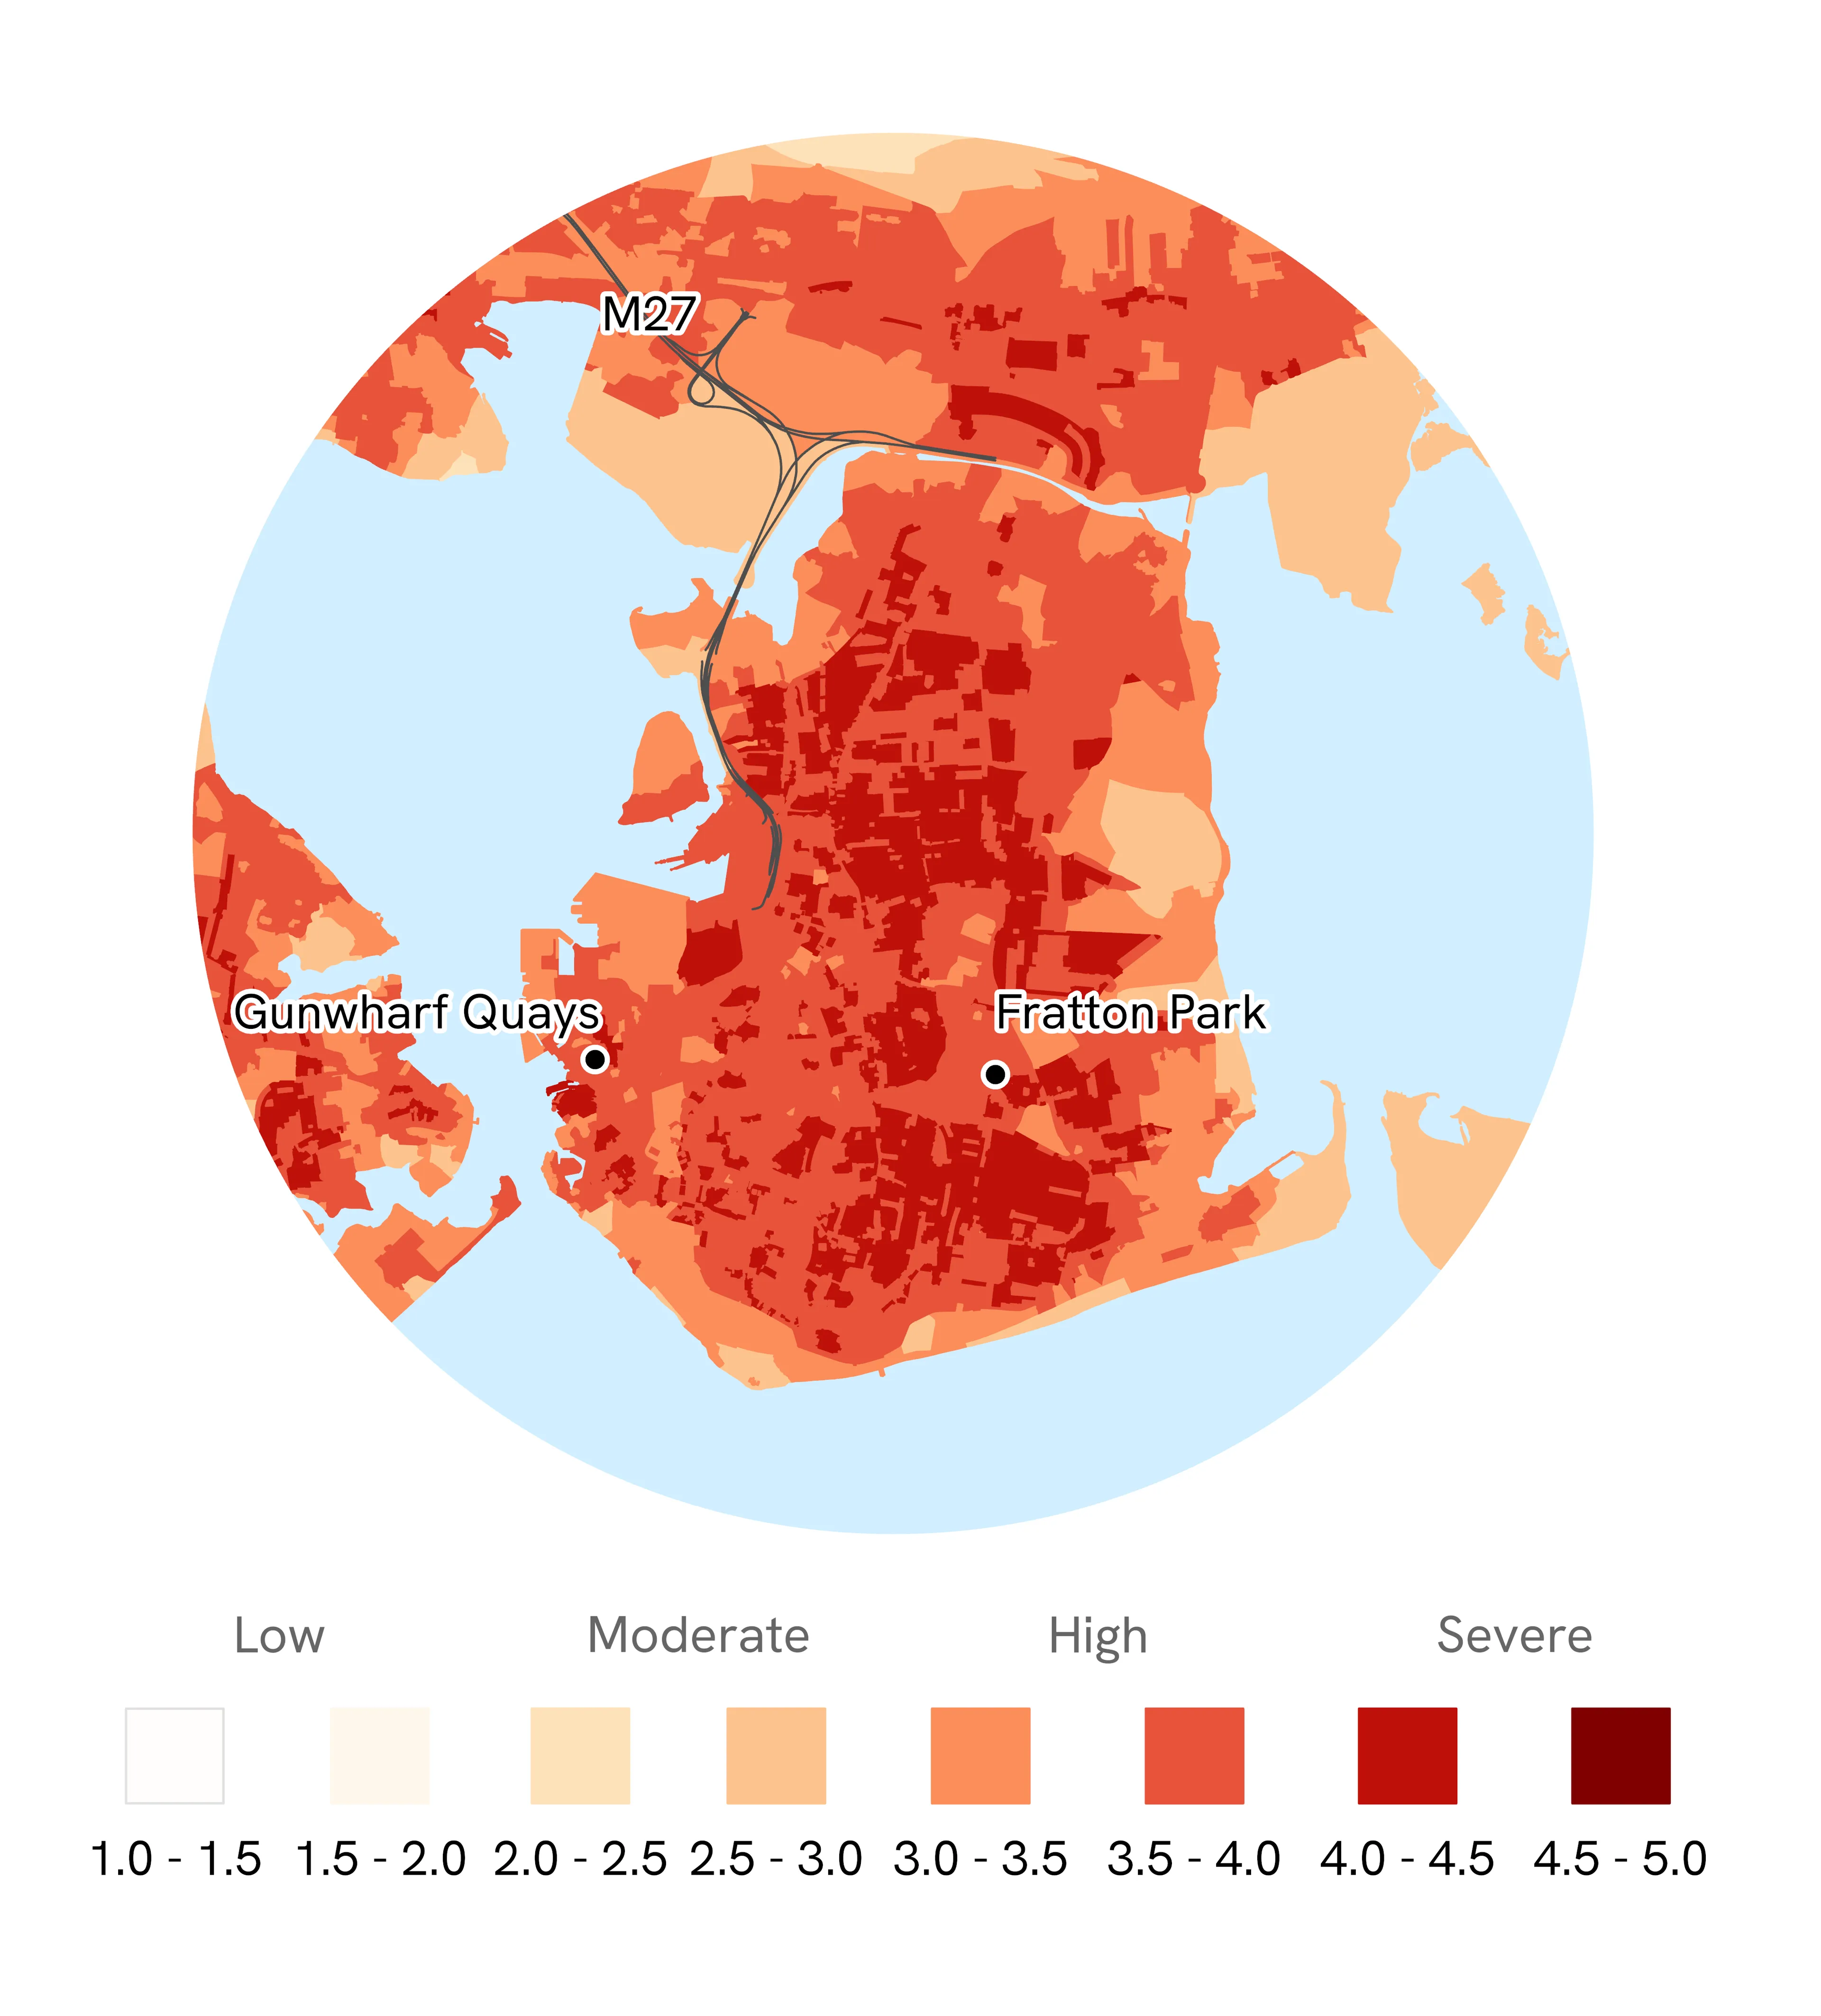
Portsmouth tops the OS Heat Vulnerability Index today and holds that position through every future time-period to the turn of the century. Its highly built-up urban environment is a major factor, ranking third in Great Britain for its built-environment vulnerability, while the city ranks 69th out of 71 for natural cooling. Portsmouth also ranks fifth for its land surface temperature over summer months, meaning high existing heat exposure is compounded by dense development, extensive hard surfaces and comparatively limited vegetation and other natural cooling features.
The findings reinforce a vulnerability already identified locally. Portsmouth City Council has highlighted areas including Somerstown, Portsea, Southsea and Fratton as particularly exposed to urban heat because of extensive hard surfaces and limited vegetation, with some areas of low green infrastructure also overlapping with higher levels of deprivation.
Milton Keynes: lower density and greater natural cooling
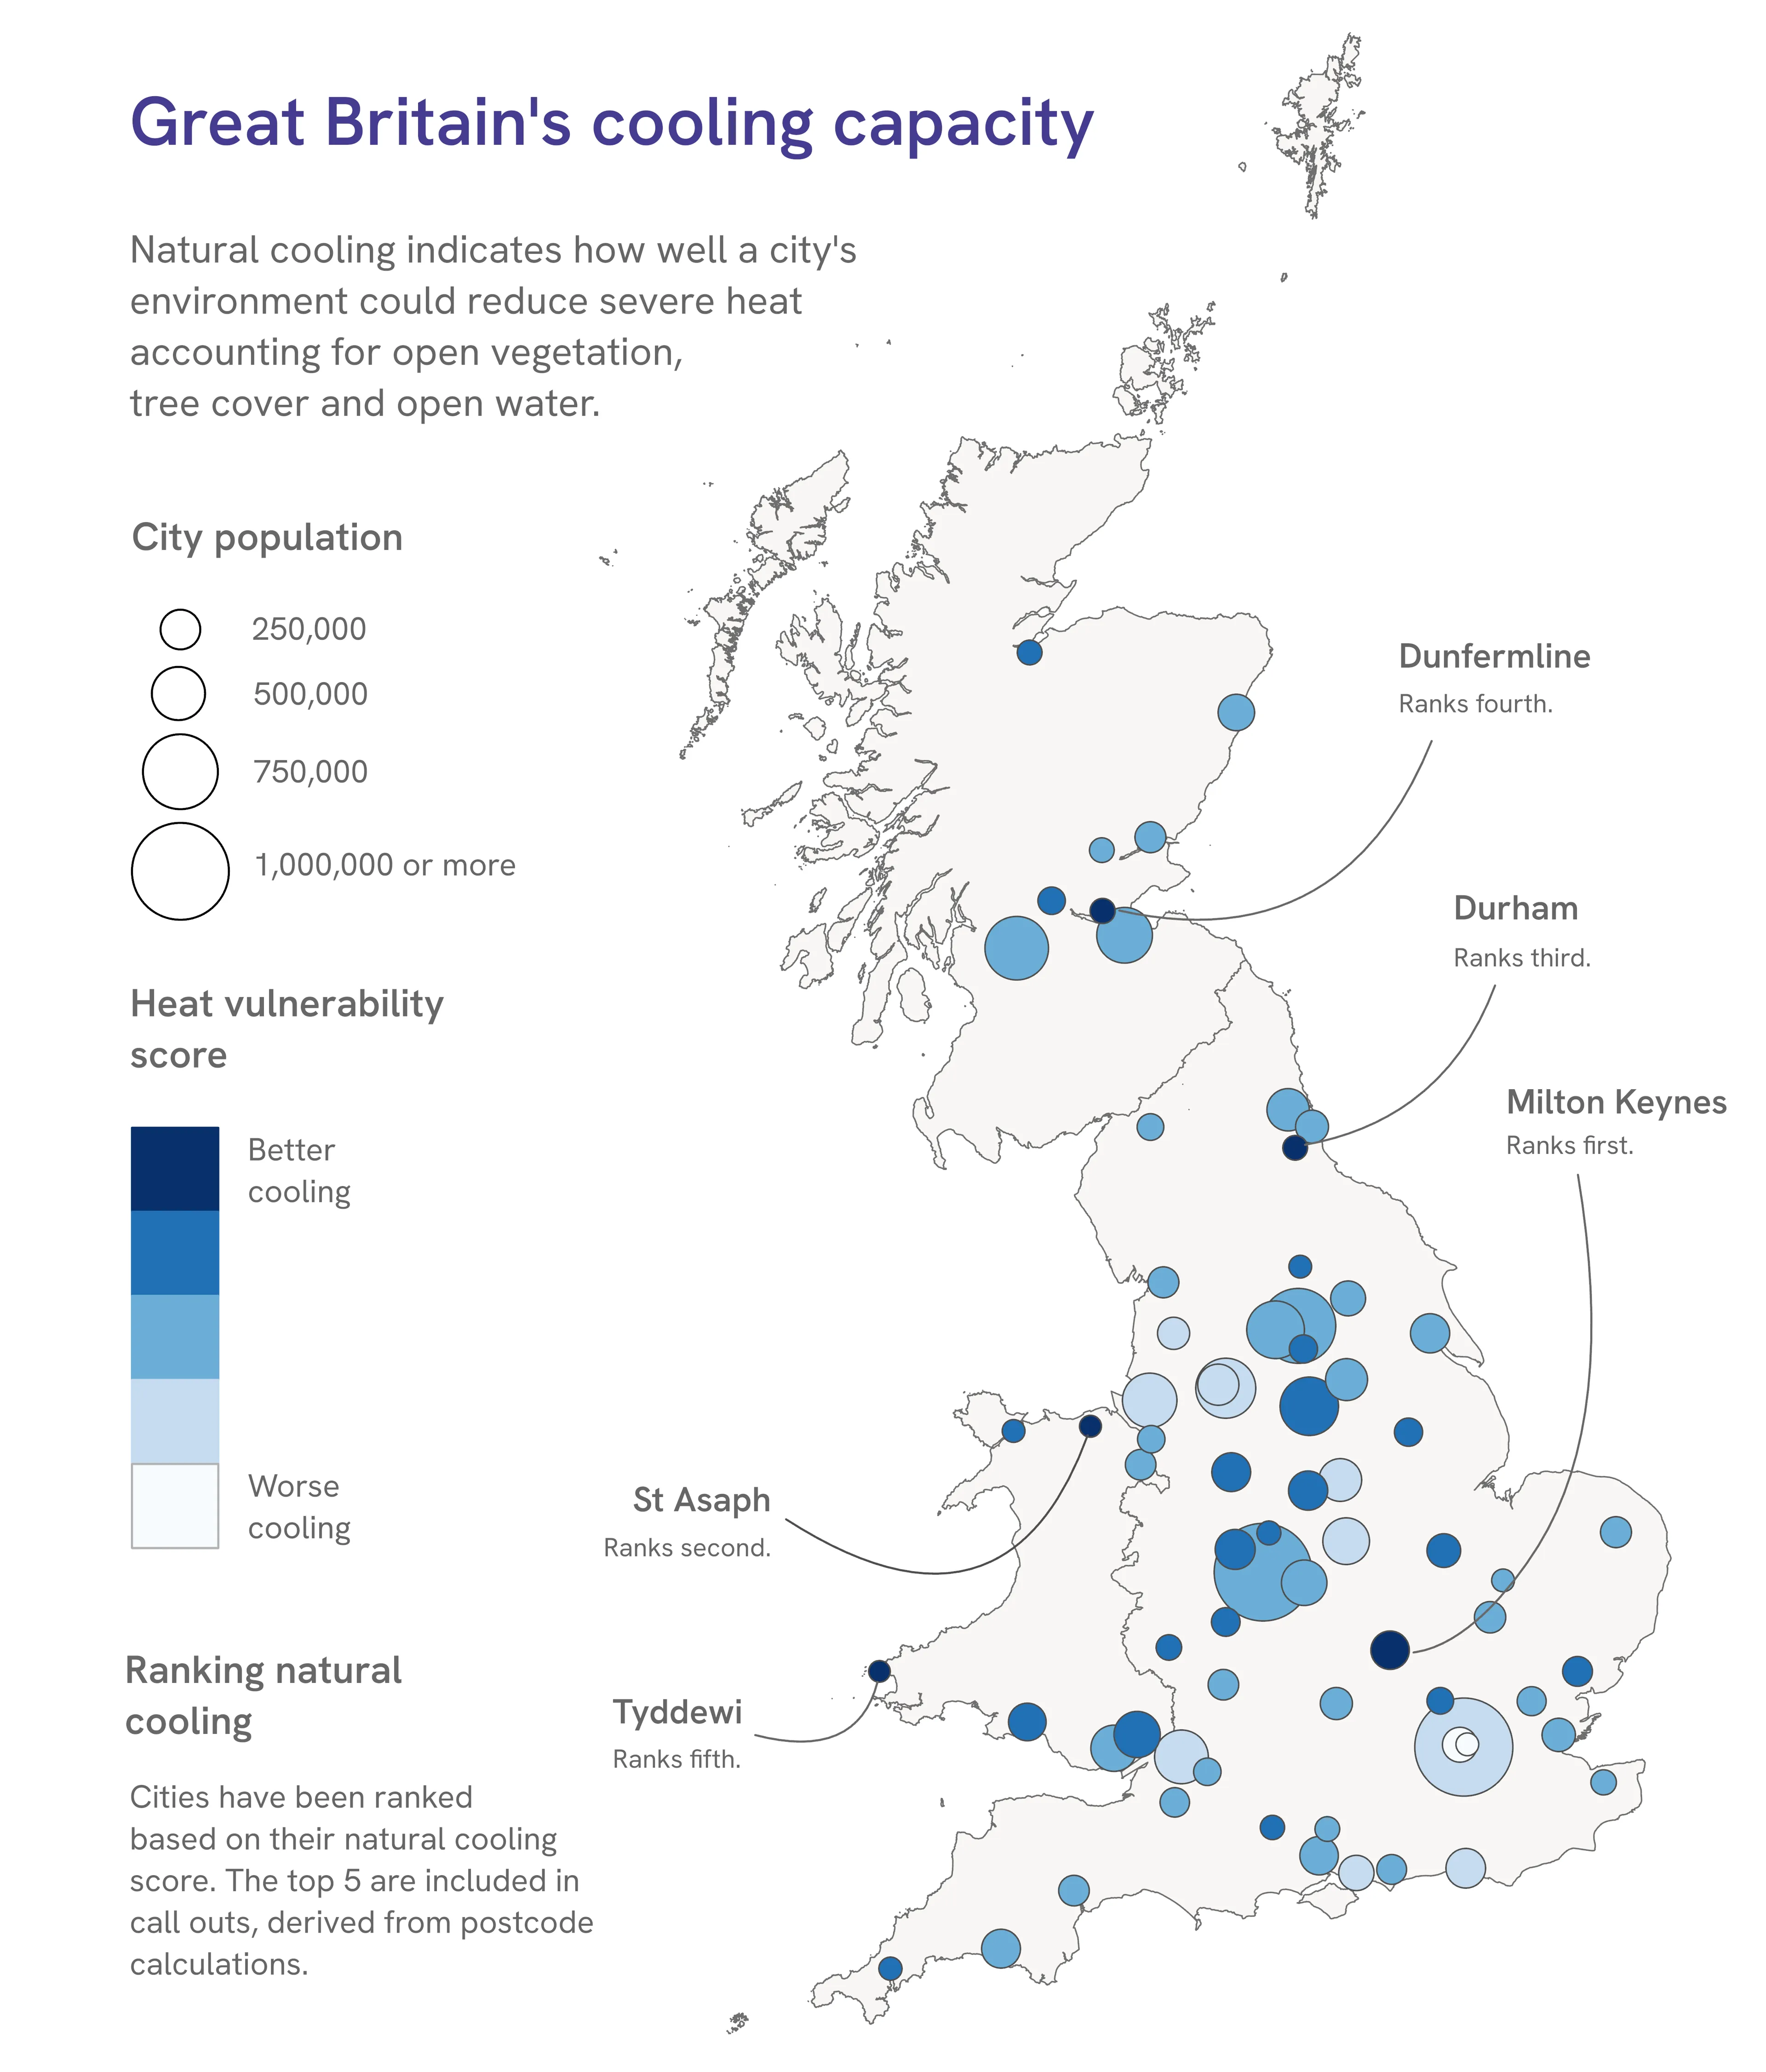
At the other end of the Index, Milton Keynes ranks 69th out of 71 cities for heat vulnerability today. It has the lowest built-environment vulnerability in England and the most effective natural cooling of any city in the analysis, with 46km² of natural surfaces combatting almost 40km² of made surfaces; making it an almost direct counterpoint to Portsmouth.
Yet even this level of natural cooling cannot entirely offset a warming climate. Milton Keynes moves from moderate to high heat vulnerability by 2040 and remains there through to the end of the century. The contrast with Portsmouth illustrates both how much difference urban form and green infrastructure can make, and the limits of that protection as background temperatures continue to rise.
As Britain's climate warms, the ability of cities to cool themselves naturally will become increasingly important. Trees provide shade and cool the surrounding air through evapotranspiration, while open vegetation and water absorb and release heat differently from buildings, roads and other hard surfaces. Cities with more of these natural features generally have a greater ability to moderate the urban heat island effect.
Table 2: Top 5 and bottom 5 cities for natural cooling:
|
Rank |
Top 5: most effective natural cooling cities |
OS natural cooling score |
Rank |
Bottom 5: least effective natural cooling |
OS natural cooling score |
|---|---|---|---|---|---|
|
1 |
Milton Keynes |
4.297 |
67 |
Preston |
4.591 |
|
2 |
St Asaph |
4.355 |
68 |
London |
4.611 |
|
3 |
Durham |
4.356 |
69 |
Portsmouth |
4.625 |
|
4 |
Dunfermline |
4.367 |
70 |
City of Westminster |
4.913 |
|
4 |
Tyddewi (St Davids) |
4.367 |
71 |
City of London |
4.959 |
Ranked 1 to 71, with 1 representing the most effective natural cooling and 71 the least effective. Dunfermline and Tyddewi are jointly ranked fourth.
Concentrated risk at these locations highlights the vulnerability of Britain's most densely built cities to retained heat. Sustained temperatures here could increase pressure on health services, strain energy and water networks, and weaken the productivity of the urban centres driving national economic output.
The results of the OS Heat Vulnerability Index reveal Britain's exposure to intensifying urban heat at postcode level and underline the critical role of authoritative location data in understanding climate risks at a local scale. By providing evidence-based insights like this, OS data can help inform national priorities such as the delivery of 1.5 million new homes, supporting decisions on where developments are placed to mitigate a warming climate, while helping target investment to strengthen national resilience and safeguard communities as climate change continues its current trajectory.
Nick Bolton added: "What the Index shows is that the severity of urban heat islands is not uniform, and the cities most at risk of overheating during a heatwave are places where the built environment has grown at the expense of the natural one. Location-based insights like this have a critical role to play in evidence-based decision-making. They show where exposure is greatest as temperatures continue to rise, which of a city's existing green and blue spaces need protecting, and where different interventions could have the highest impact in protecting communities and strengthening national resilience."
"Cities are on the front lines of climate change, and while the challenge is global its impacts are often hyper-local. Exposure can vary street by street within a single city, and the areas consistently subjected to higher temperatures than their surroundings are the ones that overheat first during a heatwave. By harnessing Earth observation data and artificial intelligence to bring it down to street level, we’re mapping how to turn thermal threats into actionable blueprints for urban resilience, supporting decisions on where heat refuges are sited and how emergency responses are planned in advance rather than in the middle of climate events."
Research Methodology
Working with the Met Office and 4 Earth Intelligence, OS scored all 71 of Great Britain's cities for present day, near term (2040 to 2069) and long term (2070 to 2100) heat vulnerability. The OS Heat Vulnerability Index combines four components at postcode level, averaged to produce a single score, then aggregated to city level.
Component 1: Temperature score, 4 Earth Intelligence Land surface temperatures averaged over summer months (May to September) derived from satellite imagery at 30 metre resolution across Great Britain. 4EI's method standardises land surface temperatures for each postcode by calculating how far each postcode's temperature deviates compared to its natural surroundings, producing a heat hazard score of 1 to 5.
Component 2: Climate change score, Met Office UKCP18, 6.0 Mean air temperature anomalies at the 50th percentile drawn from UK Climate Projections 2018 (UKCP18) probabilistic projections at 25km grid resolution, under the RCP 6.0 emissions scenario, using a baseline period of 1981 to 2010. Two future time slices are modelled: 2040 to 2069 and 2070 to 2100. Where a postcode falls within a 25km climate grid, it inherits the projected temperature anomaly for that grid.
Component 3: Built environment score, OS National Geographic Database (OS NGD) Derived from OS NGD data, combining four sub-scores: building count per postcode; average building height; average building connectivity; and made surface material cover. Gardens across Great Britain are classified as 50% made surface and 50% open vegetation.
Component 4: Natural cooling score, OS National Geographic Database (OS NGD) Derived from OS NGD data, combining three sub-scores: water cover; tree canopy cover; and open vegetation cover, each calculated as a proportion of total postcode area. Disproportionate thresholds are applied to reflect the varying cooling effects of different land cover types.
Reading the scores 1 to 2: low; 2 to 3: moderate; 3 to 4: high; 4 to 5: severe heat vulnerability.
City boundaries City boundaries follow city status granted by Royal Charter and are represented in the OS National Geographic Database (OS NGD) geographical named area dataset. The City of Westminster and City of London sit within Greater London and are reported separately from the wider London area.
External sources referenced in the release:
- Gov UK interim heat mortality monitoring report, England: May and June 2026, Published 30 July 2026
- The mortality and associated economic burden of London's summer urban heat island effect: a modelling study, The Lancet Planetary Health, 2025. View the study on PubMed
- Heat Ready London evidence on the estimated £1.5bn economic cost of London's 2022 heatwaves. Heat Ready London, London City Hall
- Portsmouth City Council assessment of local climate risks and the urban heat island effect in Somerstown, Portsea, Southsea and Fratton. Climate change risks to Portsmouth
Portsmouth City Council, Adapting to Climate Change through the Local Plan, April 2021, including analysis of deprivation, urbanisation and lack of natural features as factors affecting climate vulnerability. View the Portsmouth background paper
Sharing the latest news about OS. We can license you to use OS maps in print, online and film format. For more information and resources for journalists, bloggers and media professionals, email pressoffice@os.uk or call 023 8005 5565.
Find more news
- Built environment
- Public health and wellbeing
- Land and property
- Government and public sector
- Environment