Retail Areas: Britain’s shopping geography
A new dataset exploration, by Steve Kingston (Senior Data Scientist), Catherine Mowbray (Senior Data Engineer) Rowan Moessner (Associate Technician), Matthew Grubb (Associate Data Scientist) and Estelle Liu (Associate Data Scientist) at OS.
The various categories of our location data make for a valuable asset when conducting research. If you want to be able to see the railway lines in Great Britain, the boundaries of county councils, even list buildings by height – our data can answer these queries.
Back in March 2026, OS released its first Functional Area dataset, presenting ‘notional geographies’ reflecting where types of activity happen - in this case, retail areas. The new dataset uses three different types: aggregated (where multiple high streets and shopping centres converge), major (such as a retail park) and minor (smaller clusters such as alleyways off high streets).
The release of the Retail Areas datasets, in the OS National Geographic Database (NGD), has made it possible to see Britain’s retail geography, and at a granular scale.
Retail locations can shape how we experience places, how we move through them, how communities function, and even how they’ve developed over time. We know that retail areas can be found almost everywhere: shops, retail parks, high streets, shopping centres.
However, it can be challenging when trying to capture retail areas, consistently, and at a national scale.
OS Retail Areas data brings together different types of retail environments into one consistent framework; from Major Retail Areas like high streets, retail parks and shopping centres, through to smaller local centres and neighbourhood parades. And because they’re built within the NGD, they can be linked directly to addresses, land use, and population data, opening up entirely new kinds of analysis.
Now we can see where retail happens, the characteristics of surrounding areas, how they’re structured, who they serve, how accessible they are, and more.
How ‘retail’ are Britain’s high streets?
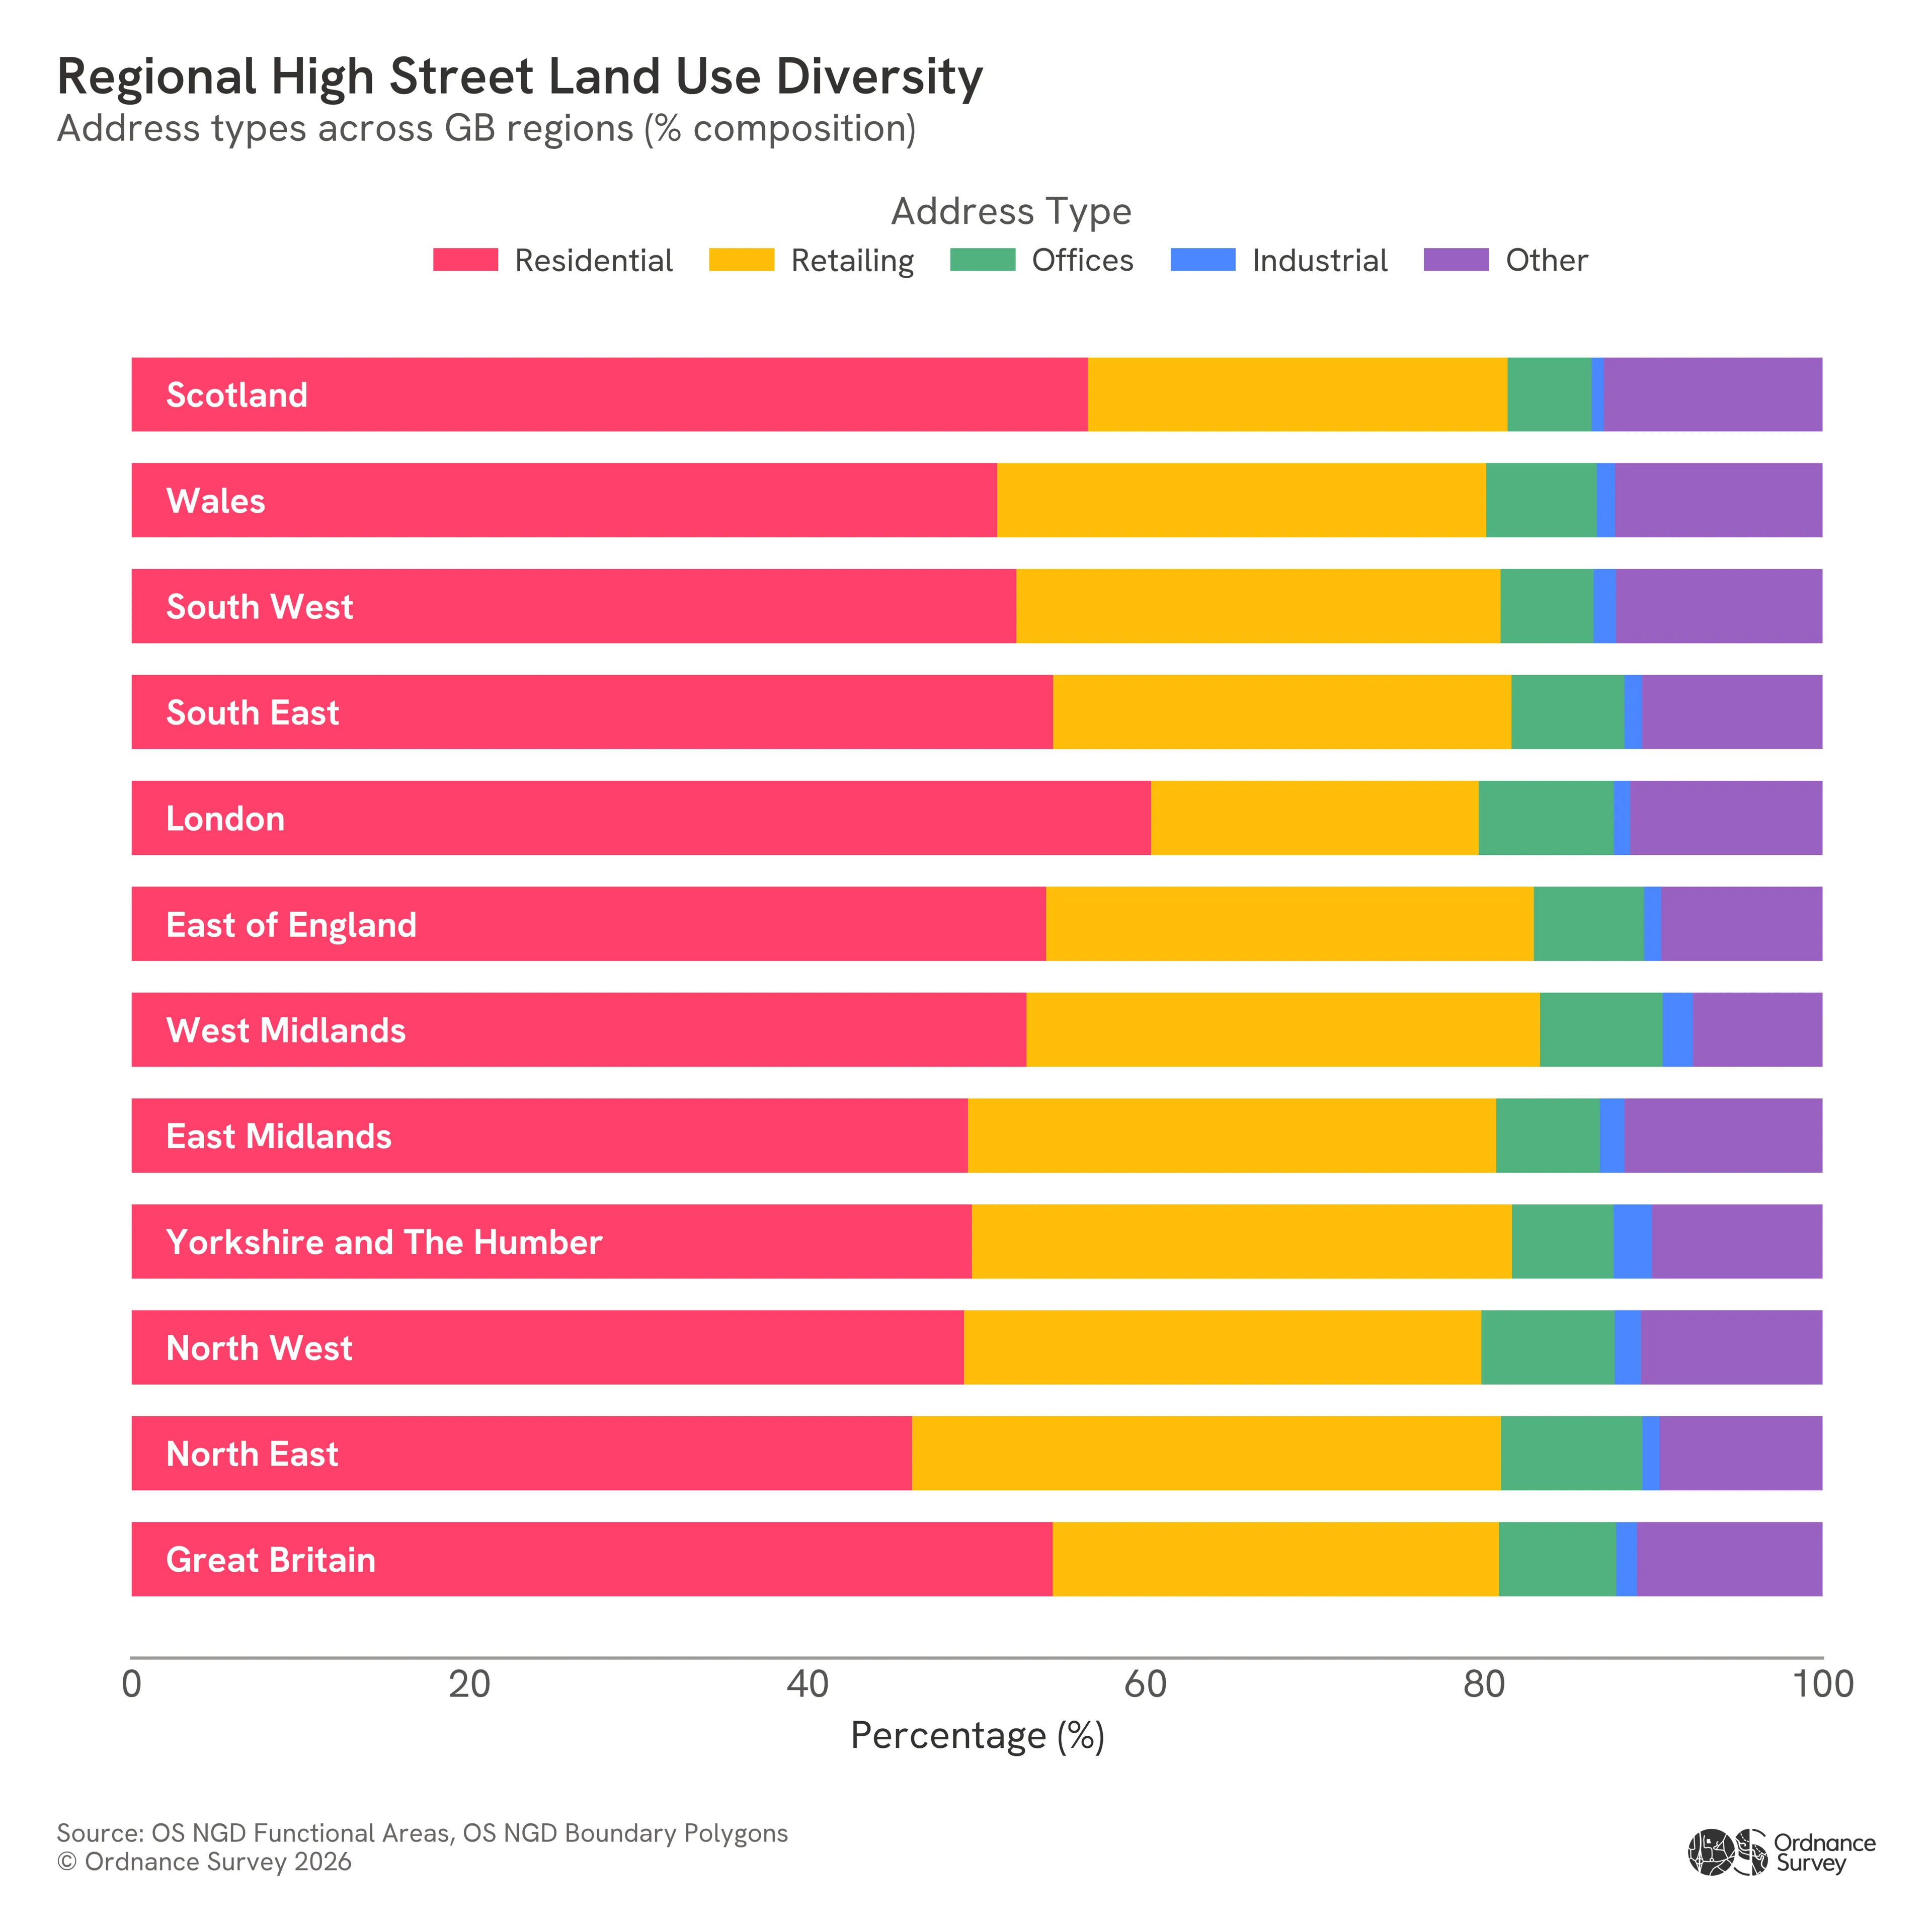
According to the new retail areas datasets, across Great Britain, over half of all high street addresses are actually residential (54.5%), while just over a quarter are retail (26.4%). This means high streets are as much a place to live as they are places to shop.
And this varies by region. London’s high streets are the most residential-heavy, with around 60.3% residential addresses, while the North-East has the highest share of retail address, but fewer total retail units overall.
Shop-filled high streets may be what we expected to see, but the reality is more mixed-use – which could affect your own data analysis and planning. Take footfall modelling as an example: periods of high footfall in a high street could suggest successful businesses, but if the street is more residential, this presents a different result.
This means that addressing data is also a critical piece of retail area insight.
Not all retail is created equal
Where retail happens is just as important as how much there is.
For the past few years, we’ve seen many stories on how high streets are shrinking, due to rises in online shopping and business rates. Even so, with this new data we’ve learned that high streets still dominate as the most prevalent retail area across Great Britain, accounting for 61.5% of retail addresses.
“Other” retail locations (mixed or undefined) make up 25.7% - which includes things airports, hospitals, and train stations, as well as small parades of shops, and rural locations of retail in villages, such as farm shops.
Meanwhile shopping centres (8.2%) and retail parks (4.8%) play much smaller roles, which was a surprising statistic, as was some of the regional differences: London, for example, leans heavily into traditional high street retail. Nearly 75% of retail addresses are on high streets, while just 1.4% are in retail parks.
Compare that once more to the North-East, high street share drops to 53.5%, and “other” retail becomes much more prominent.
Meanwhile, the East Midlands stands out as the only region where retail parks outweigh shopping centres.
These differences start to tell a story about urban formation, land availability, and how retail has evolved regionally over time. Because the Retail Areas dataset hasn’t just unlocked new insight on place and function – they’ve revealed some history too.
Retail through the ages
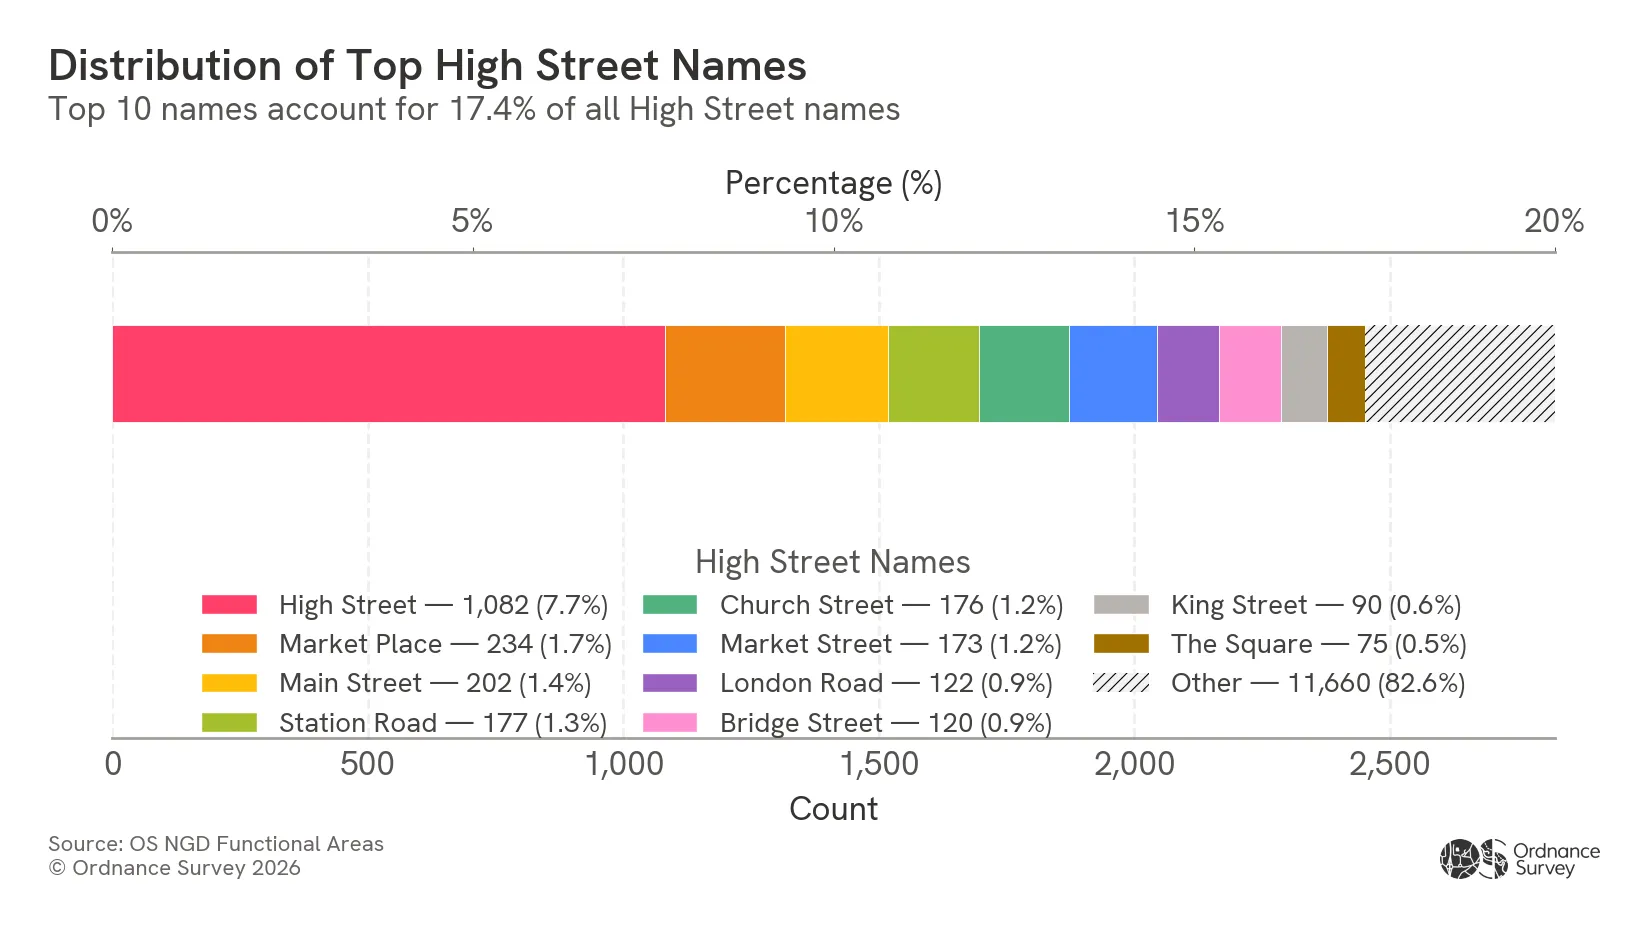
When looking at high street names in Great Britain, we quickly discover that the most common name is, unsurprisingly, “High Street” with more than over 1,000 instances across Britain. After that, variety takes over with names like:
- Market Place
- Station Road
- Church Street
- Bridge Street
Many of these locations reflect historical features (markets places, transport links, crossings, locations of religious importance) which in turn gives clues to how these places developed over time. You start to appreciate how a community (and its retail area) could have expanded around critical infrastructure, such as near train lines and rivers for transporting goods.
There are also regional quirks:
- In the North-East, “Front Street” is more common than “High Street”
- In the North-West, “Market Street” occasionally takes the top spot
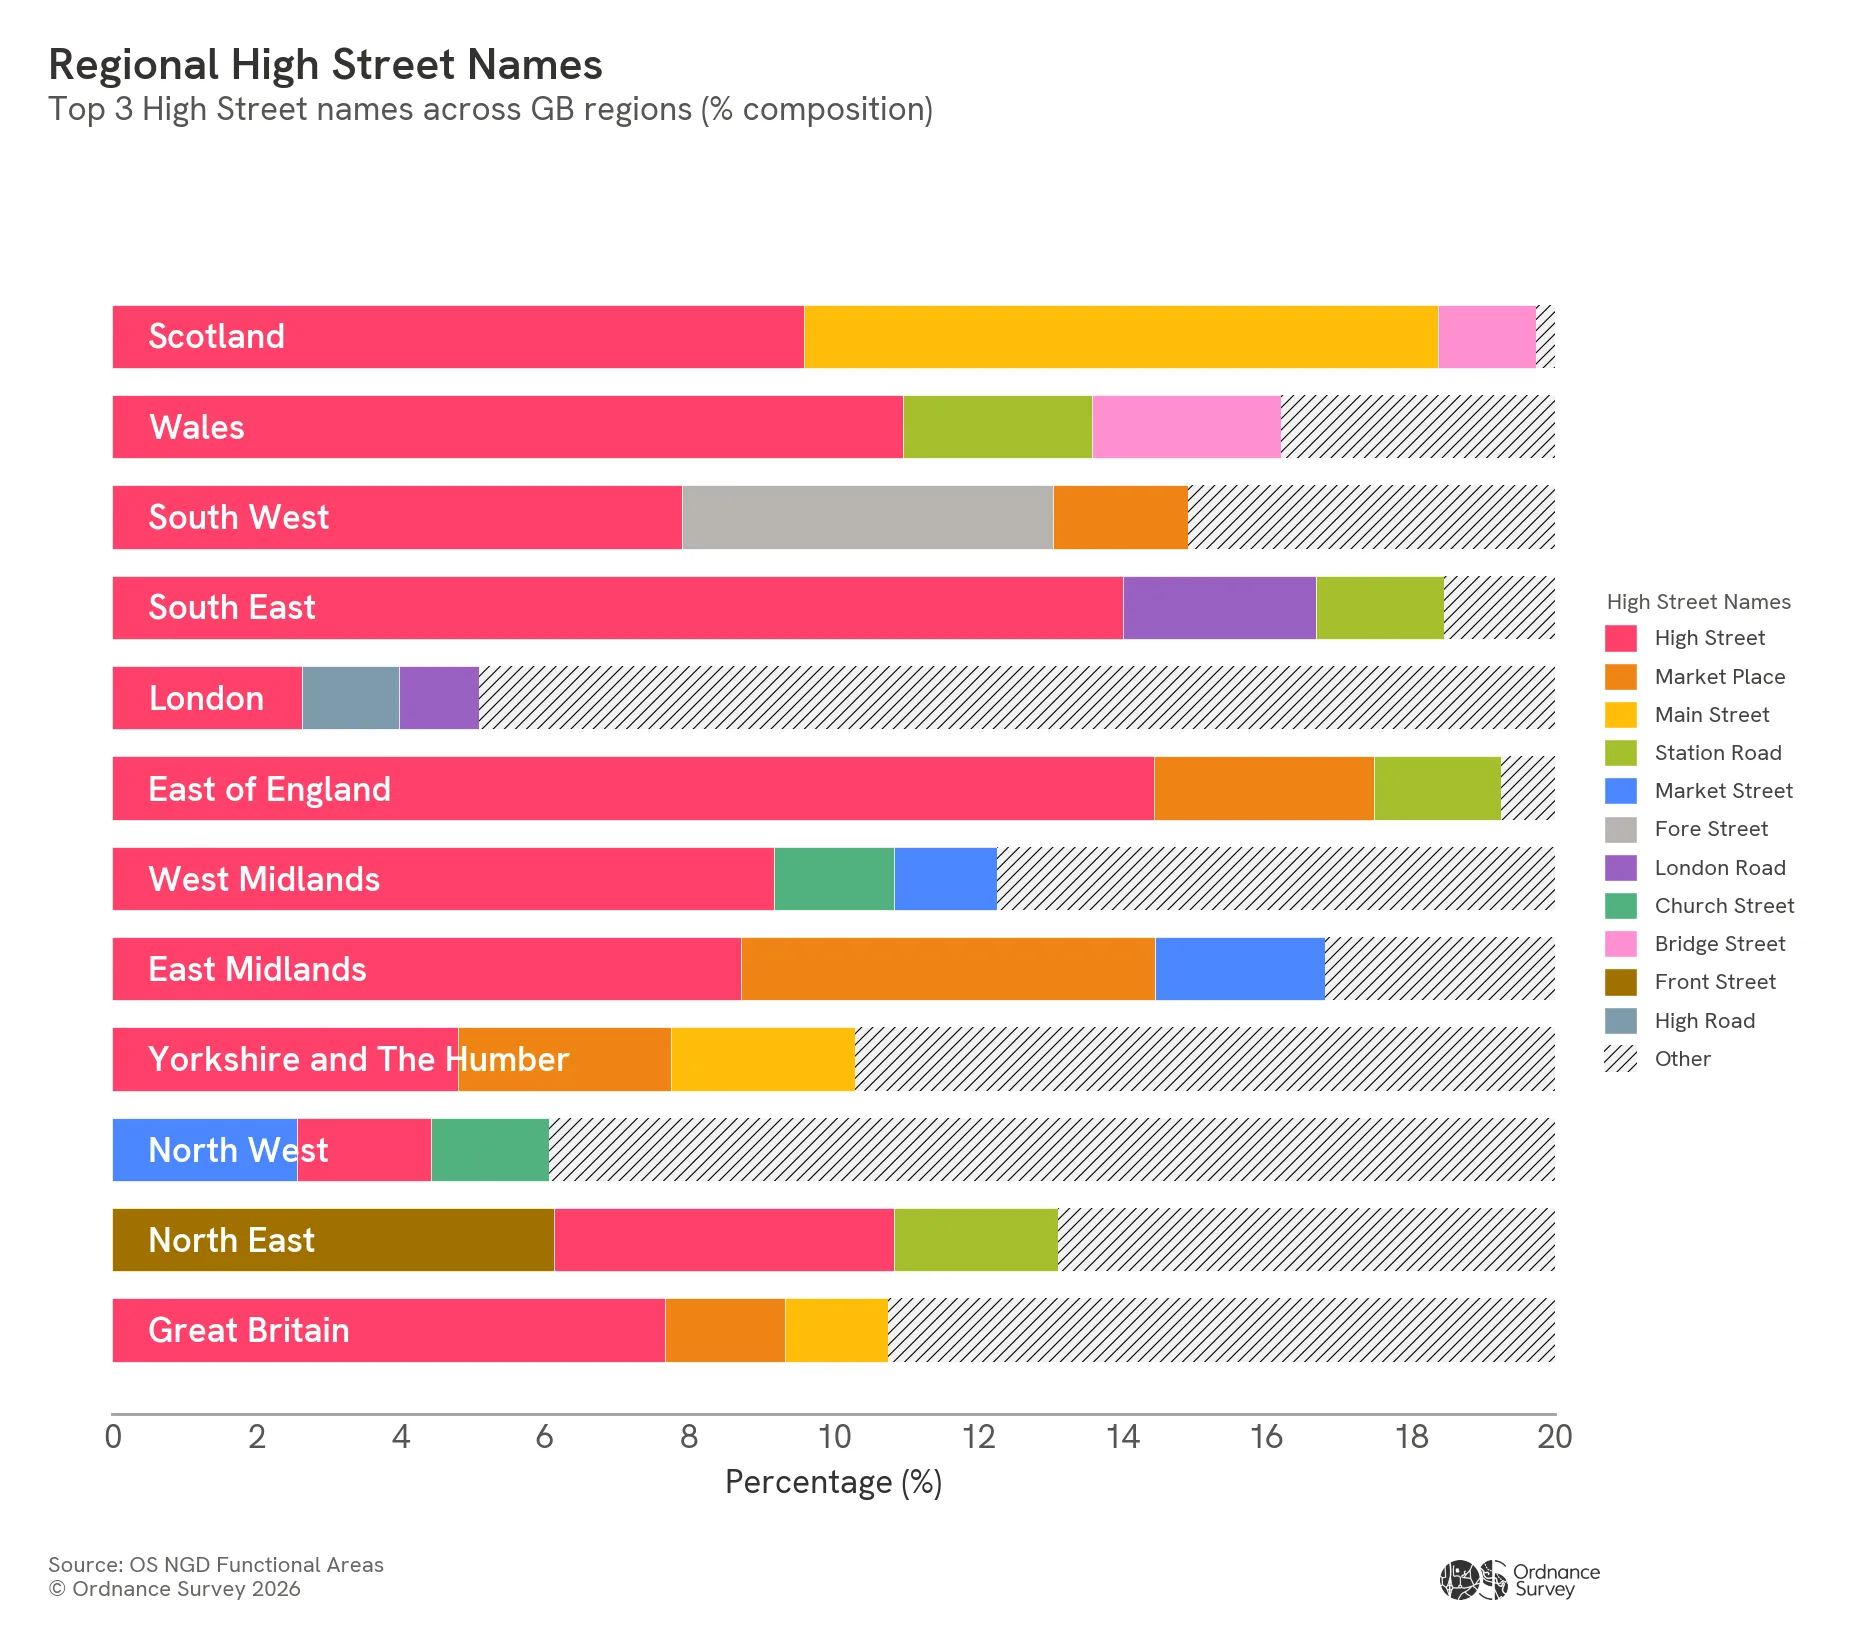
And in Wales, Welsh-language variants sit alongside English names, showing how retail geography intersects with cultural identity.
Going with the flow: how retail areas connect
Taking a more historical view then let us look at structure and connectivity: how retail spaces join together; how separate streets have grown and connected over time to form continuous ‘corridors’ of retail.
When we identified adjacent high streets, and linked them into longer chains, we discovered that 8 of the 10 longest high street corridors in Great Britain are in London.
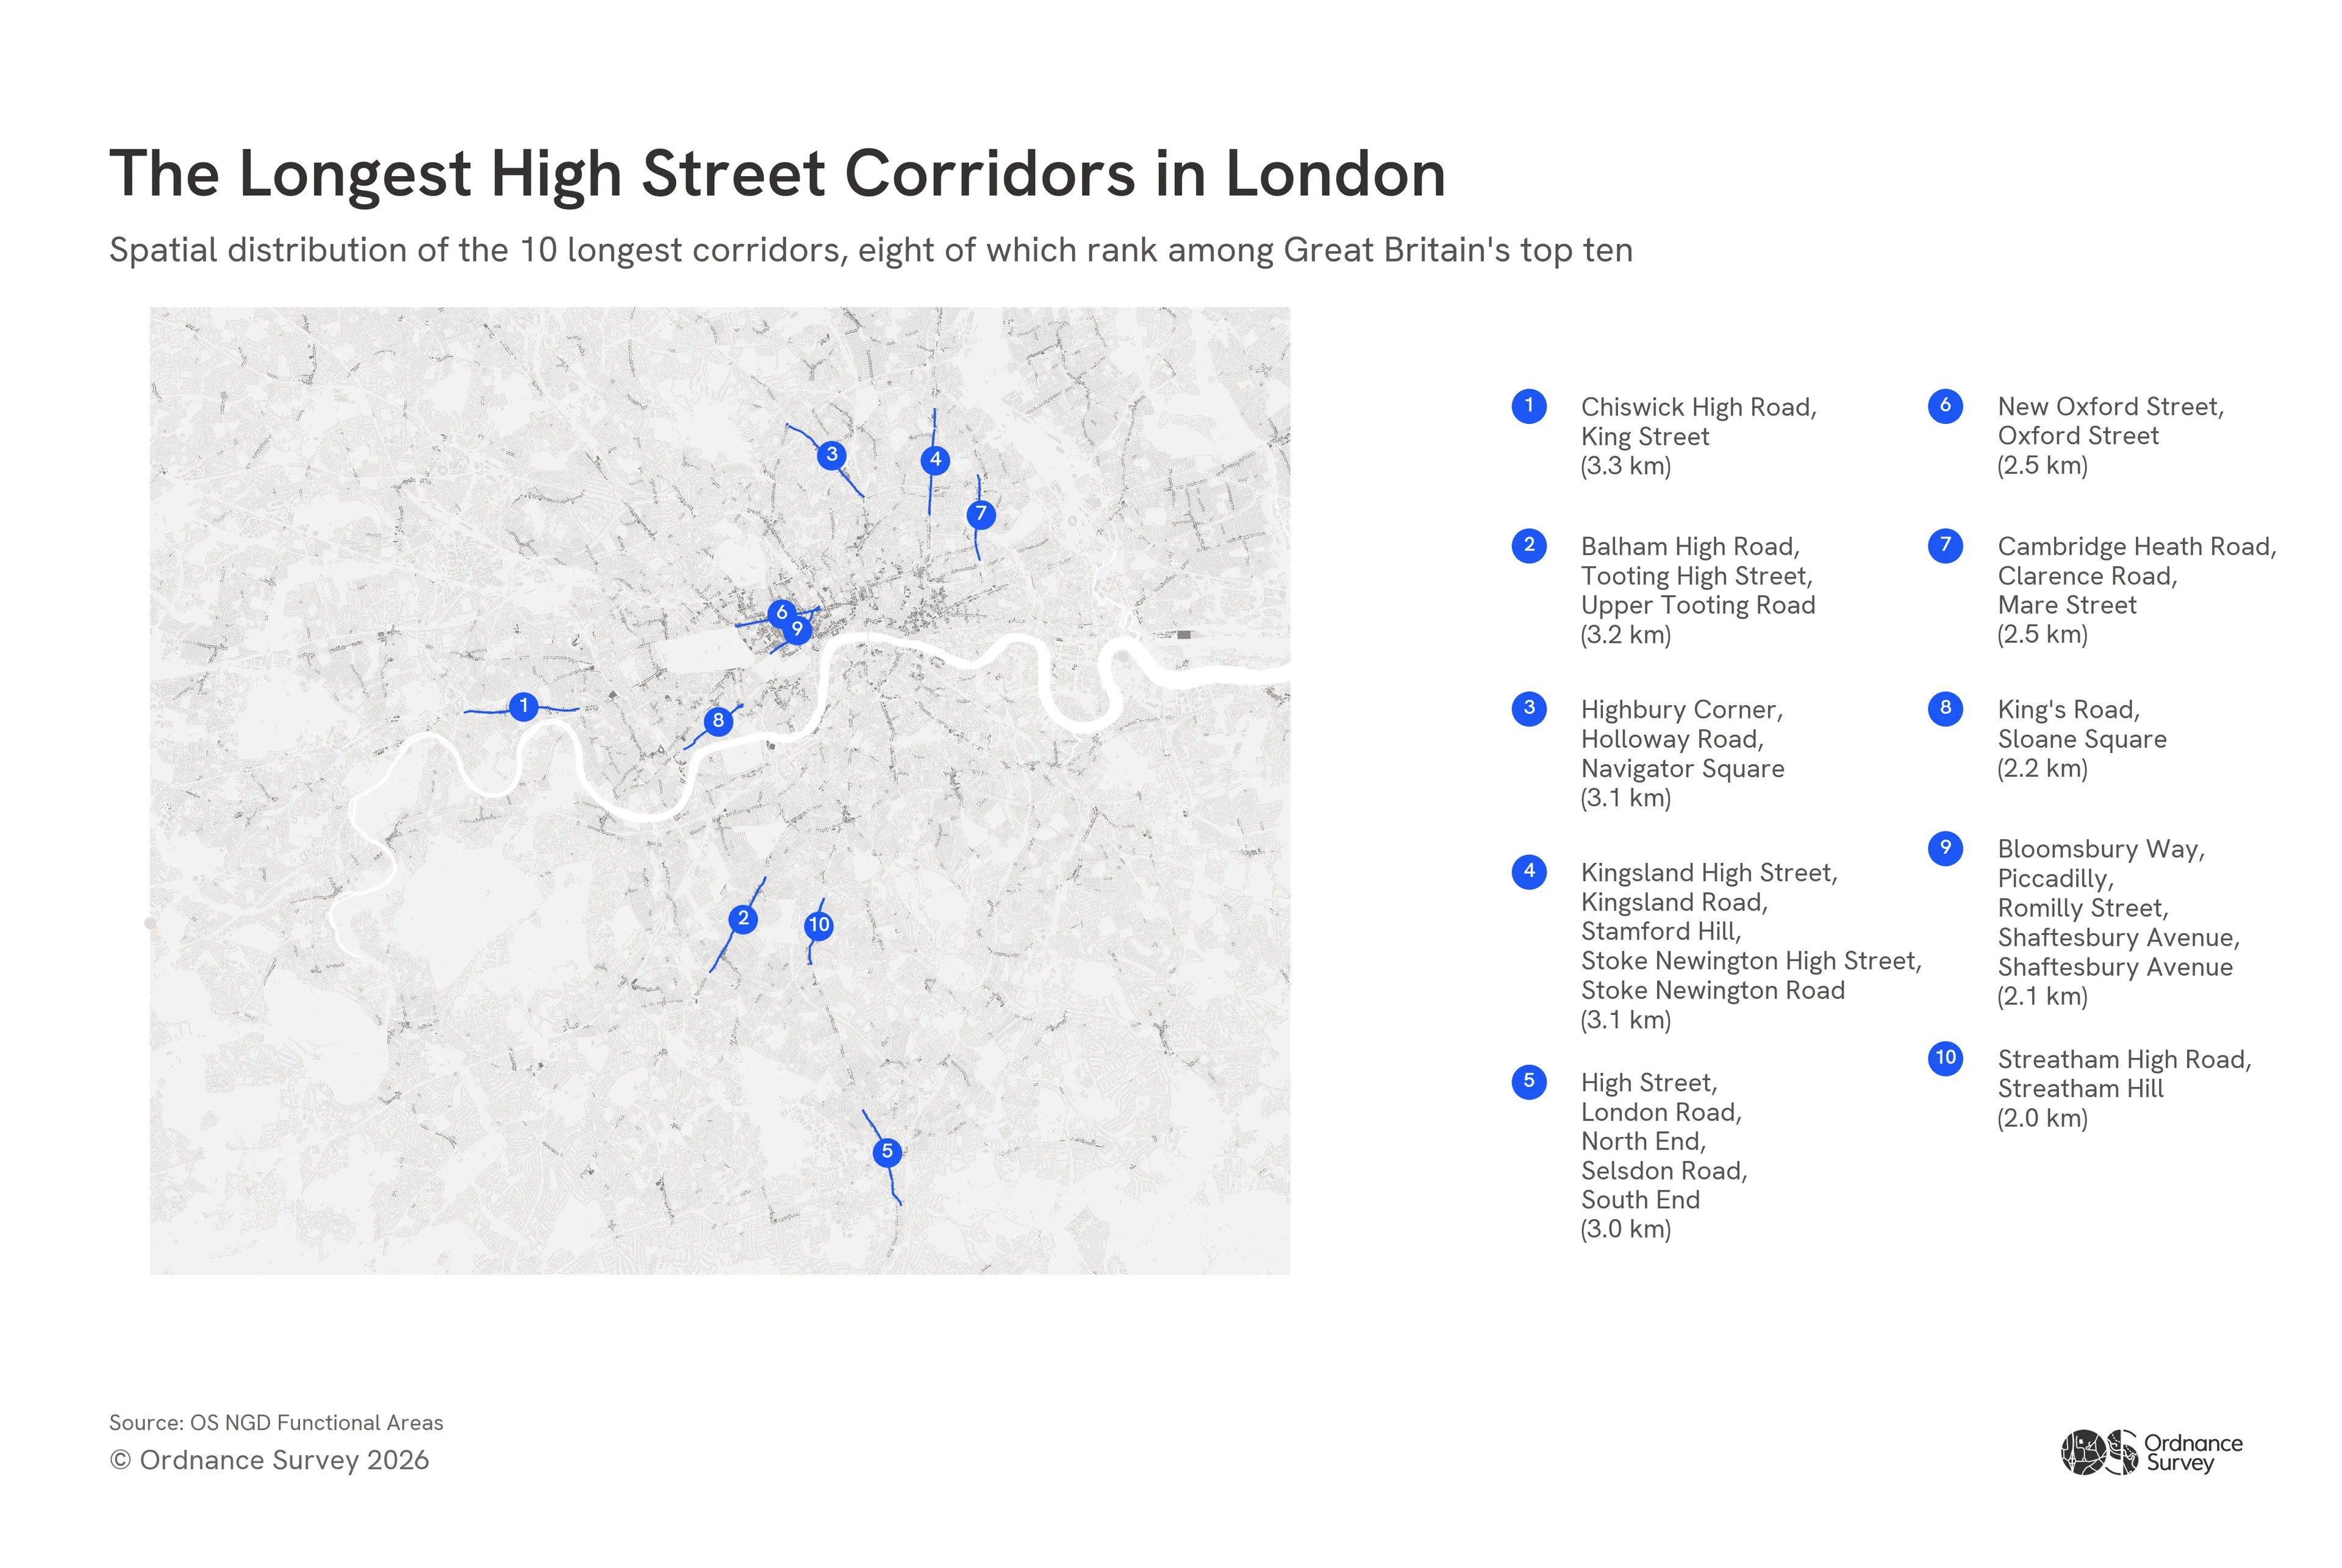
The longest is King Street, Chiswick High Road, at 3.34km. Outside London, the longest example runs through Liverpool (Allerton Road to Smithdown Road) at around 2.37km.
This kind of analysis is only possible when retail is mapped consistently; now we have this data at our disposal, it opens new ways to understand footfall, connectivity, and economic activity.
It also leads to new questions to be answered. Do the longer high street chains see the most financial success, or do shoppers prefer a shorter, more convenient experience? Of that 3.34km in King Street, London, how much footfall does the entire street see – are shoppers just walking a fraction of it?
Appropriately, we can then start to look at the accessibility of retail, the catchment areas involved, to consider:
How far do we travel to shop?
Using population data and travel times, we discovered that over 99% of people in Great Britain live within a 15-minute drive of a retail area, and 99% are within a 15-minute drive of a high street.
Even walking distances are impressive:
- 65% of people live within a 15-minute walk of a retail area
- 82% are within walking distance of a minor retail area (like a local parade)
This reflects a clear hierarchy: small, local retail is highly accessible and widely distributed, while larger centres serve broader catchments, often requiring travel.
This adds a new layer of detail to the ‘shrinking highstreets’ concept: if high street retail areas are so accessible, why do shoppers choose elsewhere? If the convenience of the location isn’t the primary obstacle, what else can be done to improve local high streets to encourage more business?
Richer details of Britain’s retail landscape
The new OS Retail Areas dataset did lead us on an explorative journey: addressing data led us to the historic element of retail areas, that in turn inspired us to look at connectivity, and accessibility.
That’s the advantage of Retail Areas being part of the OS NGD: intricate detail that can be interconnected with other datasets. You can link retail to addresses and land use, population and demographics, transport networks, buildings and infrastructure. You can move beyond mapping and categorisation, and start asking deeper questions of your own:
- Where are high streets most dependent on residential populations?
- Which regions rely more on retail parks vs traditional centres?
- How accessible is retail to different communities?
- Where are the longest, most connected retail corridors?
OS Retail Areas has been built to support real-world analysis, whether that’s planning, investment, site selection, or understanding changing consumer behaviour.
And as our early insights show, once you start exploring, the dataset quickly reveals patterns that aren’t obvious on the surface.
Try OS Retail Areas for yourself
Retail Areas offers you a new lens on Britain’s everyday geography: the unexpected residential nature of high streets, the near-universal accessibility of retail, the regional quirks in how places are named and structured.
OS Retail Areas is a clearer view of where Britain shops, how those locations perform, to answer the bigger, all-important question: why? Why do shoppers choose one retail location, over another?
Whether you’re analysing markets, planning services, public or private sector, start exploring your local retail areas by clicking below to get started.

Our highly accurate geospatial data and printed maps help individuals, governments and companies to understand the world, both in Britain and overseas.
Products and solutions featured in this insight
OS Functional Areas
OS Functional Areas provides a view of retail activity across Great Britain including where retail clusters exist and how they function and compare.
Find more Insights
- Built environment
- Retail