Comparing the past to the present with the new OS Maps API layers
We were keen to get our hands on the new OS Data Hub maps API layers when these were launched on 1 July. For the last ten years, the NLS has been happily using OS OpenData as a modern map layer in our maps website viewers, but the new OS Maps API layers have a number of advantages over these.
The benefits
First of all, the previous OS OpenData layers had to be downloaded and reprocessed in order to make them usable on our website. As we used four separate OS OpenData products at different scales – Miniscale, 1:250,000 colour raster, VectorMap District and Open Map Local – each needed to be downloaded processed separately, and then re-combined together as a web-ready tileset, to display properly at different zoom levels, so it always took a few days to do. In contrast, the new OS Maps API just involves a few lines of JavaScript to plug into – in ten minutes, you can get everything up and working (see ‘How to use the OS Maps API’ heading below).
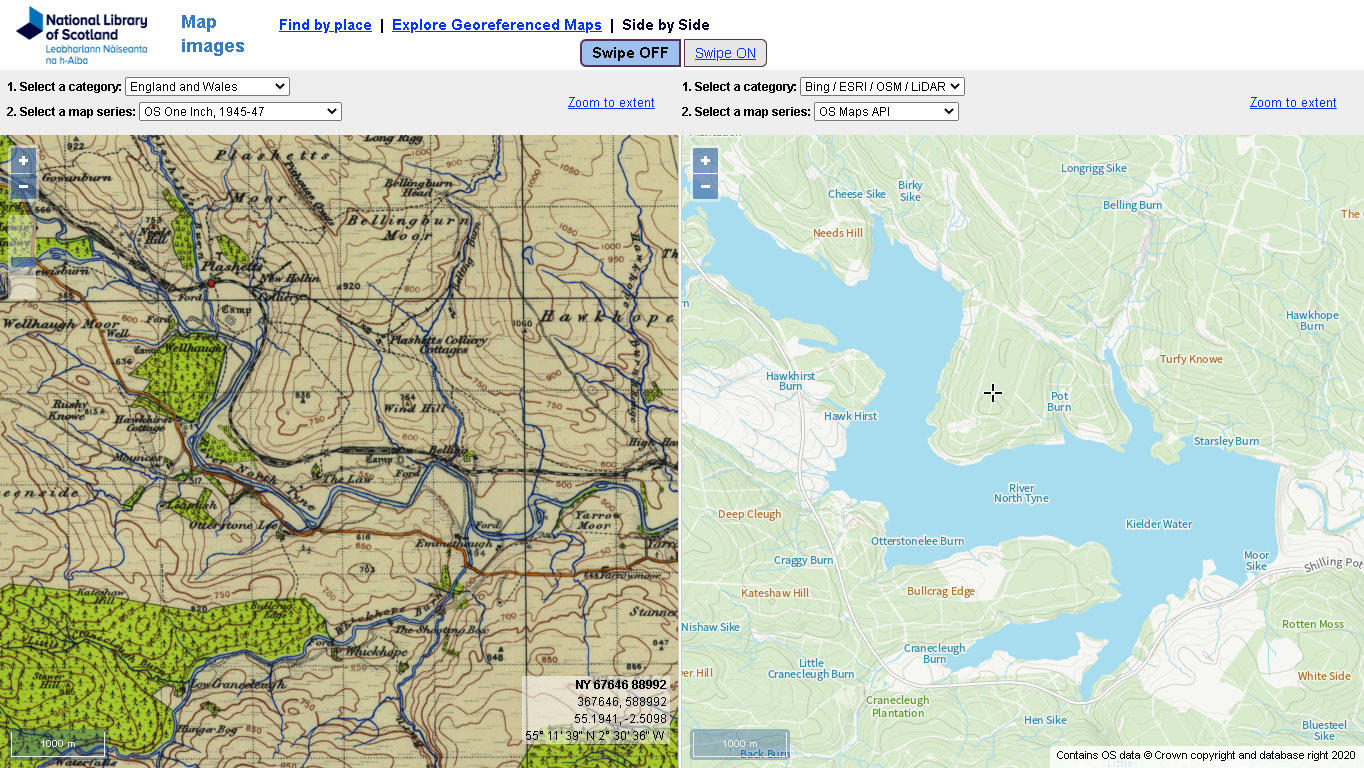
A second, related advantage, is that we don’t need to worry about keeping the mapping up-to-date ourselves, as the live layer is pulled in dynamically from the OS servers. For the last few years since the Queensferry crossing over the Forth opened in 2017, our OS OpenData from 2015 didn’t even show the projected bridge, so its nice to see it really there now on the maps where we knew it was all along.
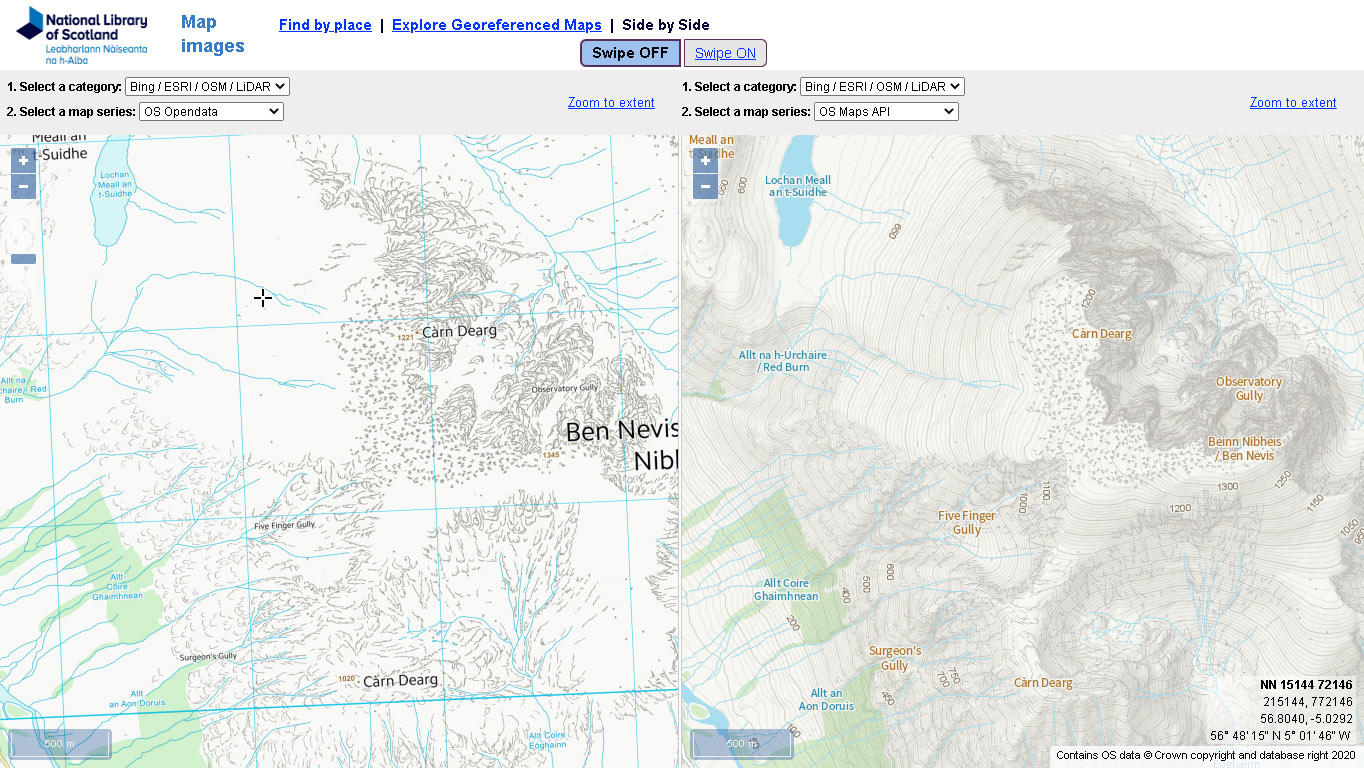
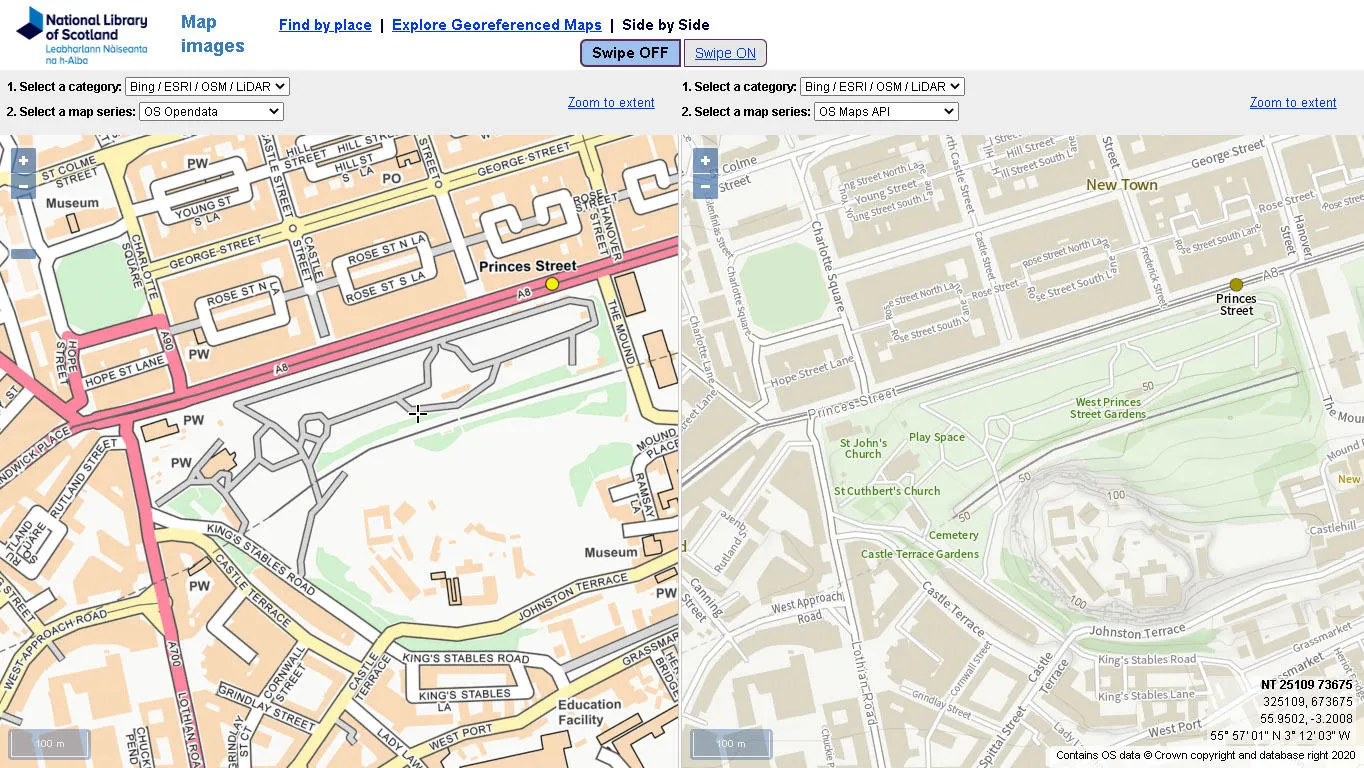
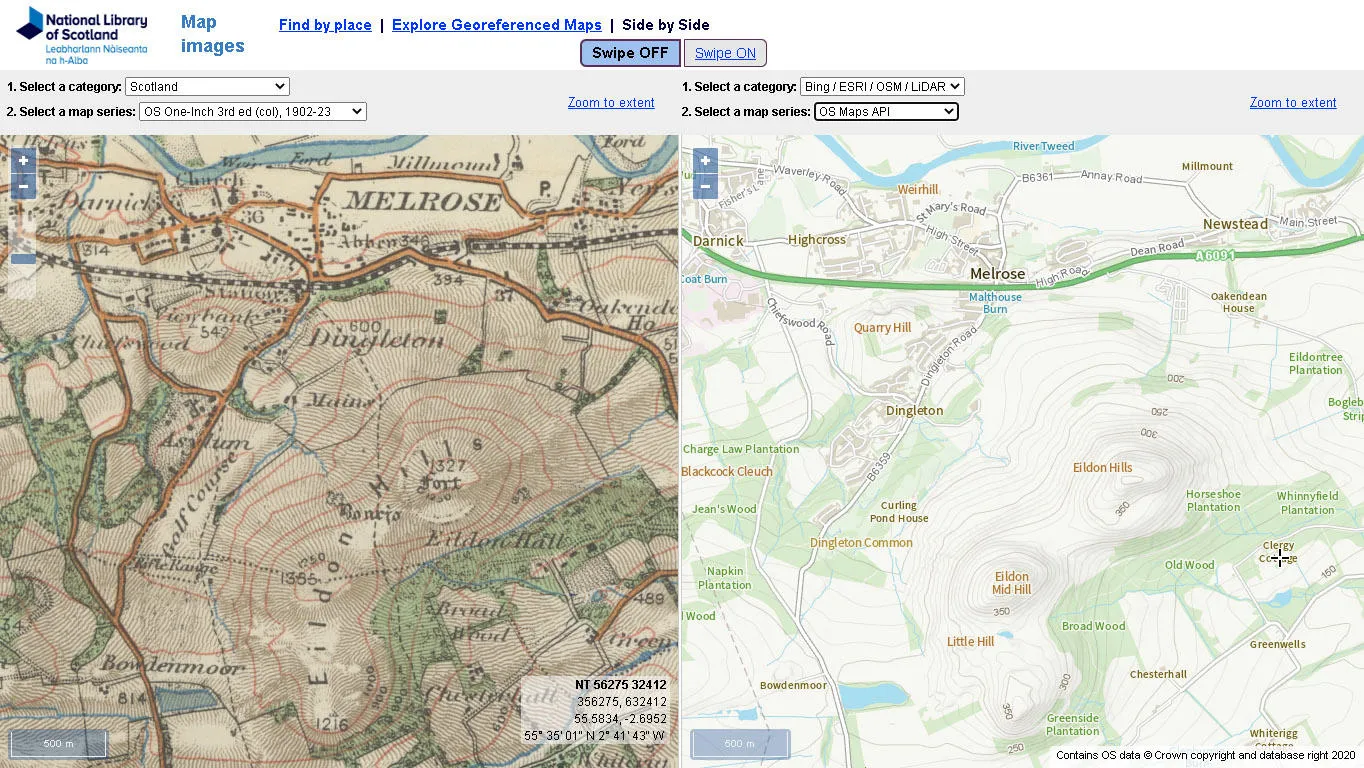
But perhaps the most important advantage is that the mapping itself is significantly improved in terms of styling and content. As users zoomed in and out with the previous separate OS OpenData products the contrast in styling when jumping between the layers was quite obvious, whereas now different zoom levels look and feel like a single integrated map. More important still, especially at larger scales, is the much richer topographic content. VectorMap District and Open Map Local had no contours, which in many of the hillier parts of the country, meant that the sense of topography and relief was very difficult to convey.
There are also a number of styling improvements to land use and text for features, so that things like parkland and woodland are easier to tell apart, more minor street names can be shown in urban areas, and different coloured lettering distinguishes things like schools, hospitals and churches from street names.
Use of the OS Maps API on the NLS website
The National Library of Scotland currently makes available over a quarter of a million high-resolution images of historic maps through our website at https://maps.nls.uk. Whilst the focus is on Scotland, the map collection is international, and we have good online coverage of maps of England and Wales too, as well as scattered locations overseas.
We currently have just over 15% of our paper collection online, but we hope to expand this to 30% over the next five years, especially with more overseas mapping. As the NLS is a legal deposit library, we have been grateful to receive Ordnance Survey paper maps as they were published over the years, and these out-of-copyright historic OS maps are by far the most significant online category in terms of volume of maps and user interest.
Our map viewers fall into two main types: first, a couple of applications for finding and searching for maps, and second a suite of viewers for exploring georeferenced maps.
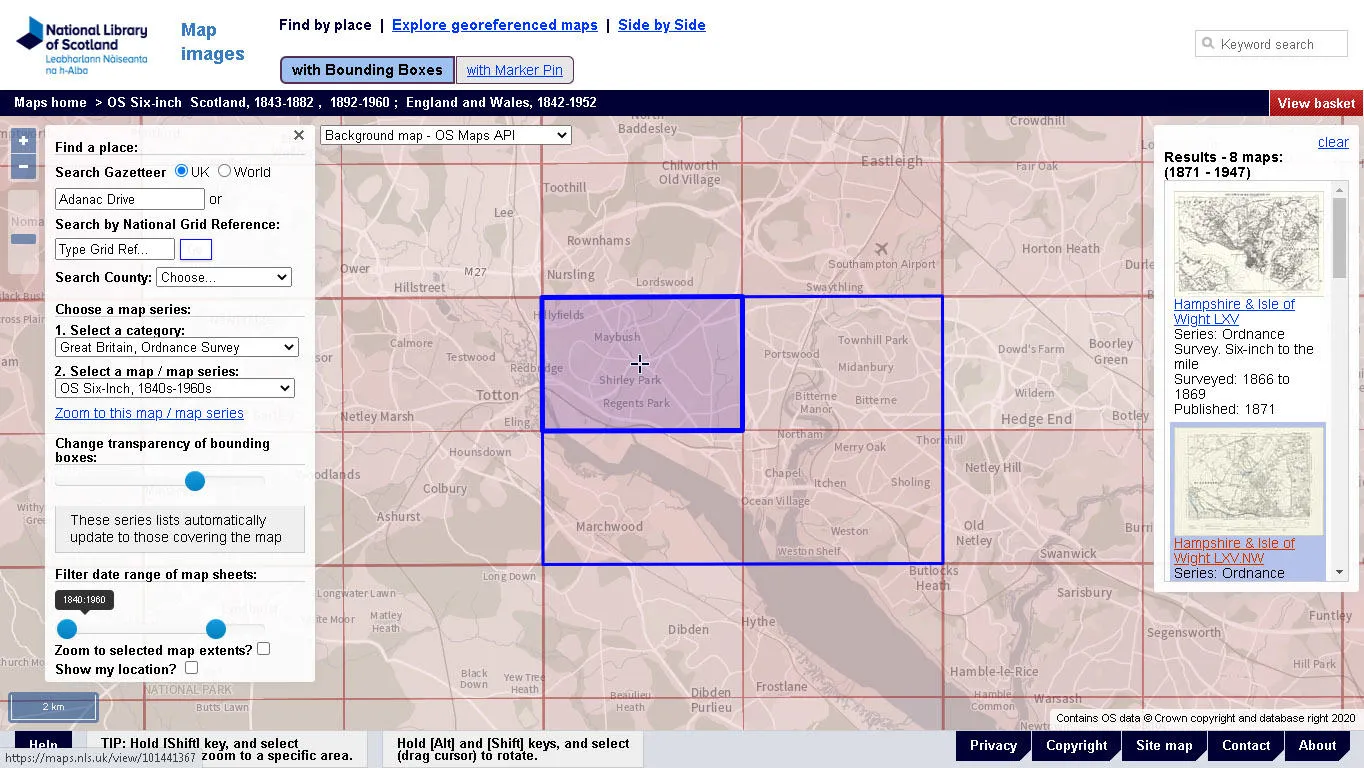
Our main application for searching for maps is the main Find by Place viewer, and we incorporated the OS Maps API Light Style into this as it displays as a set of shades of grey, ideal for backdrop mapping.
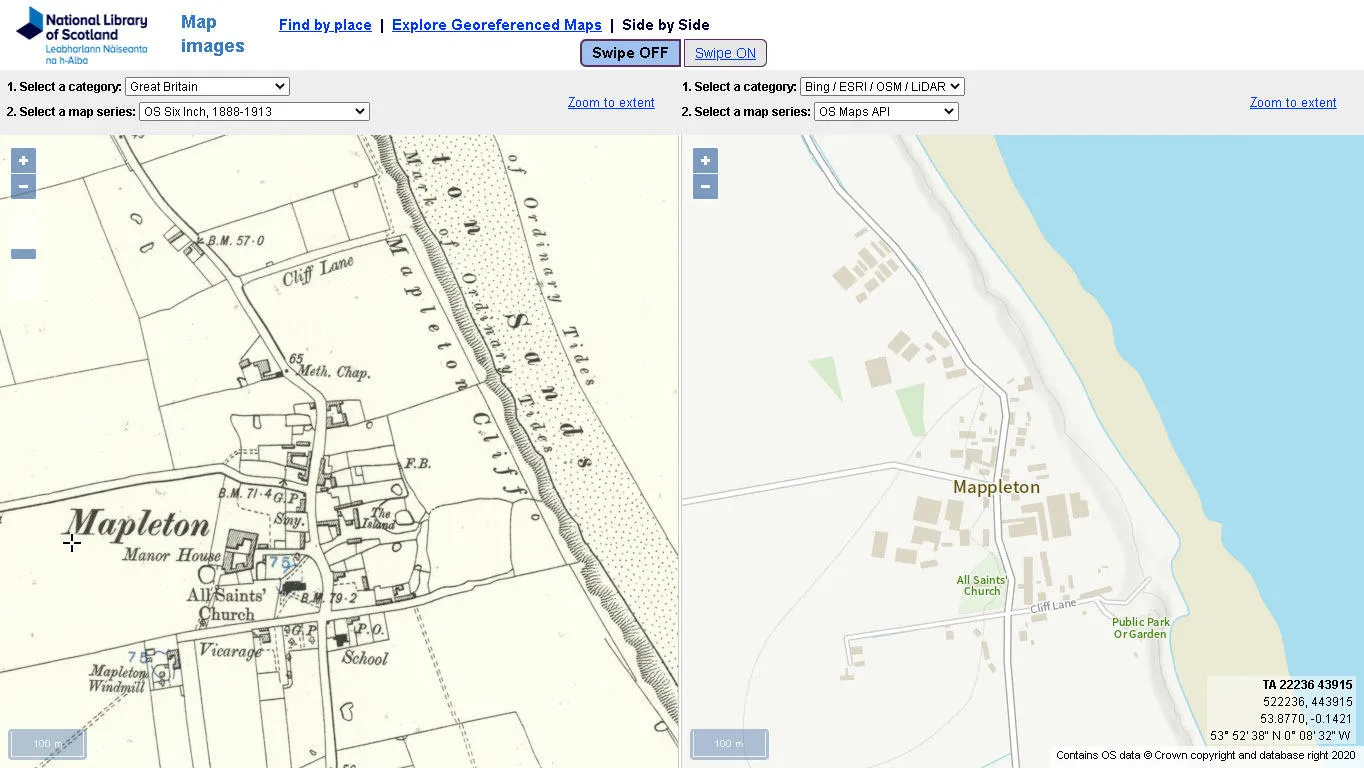
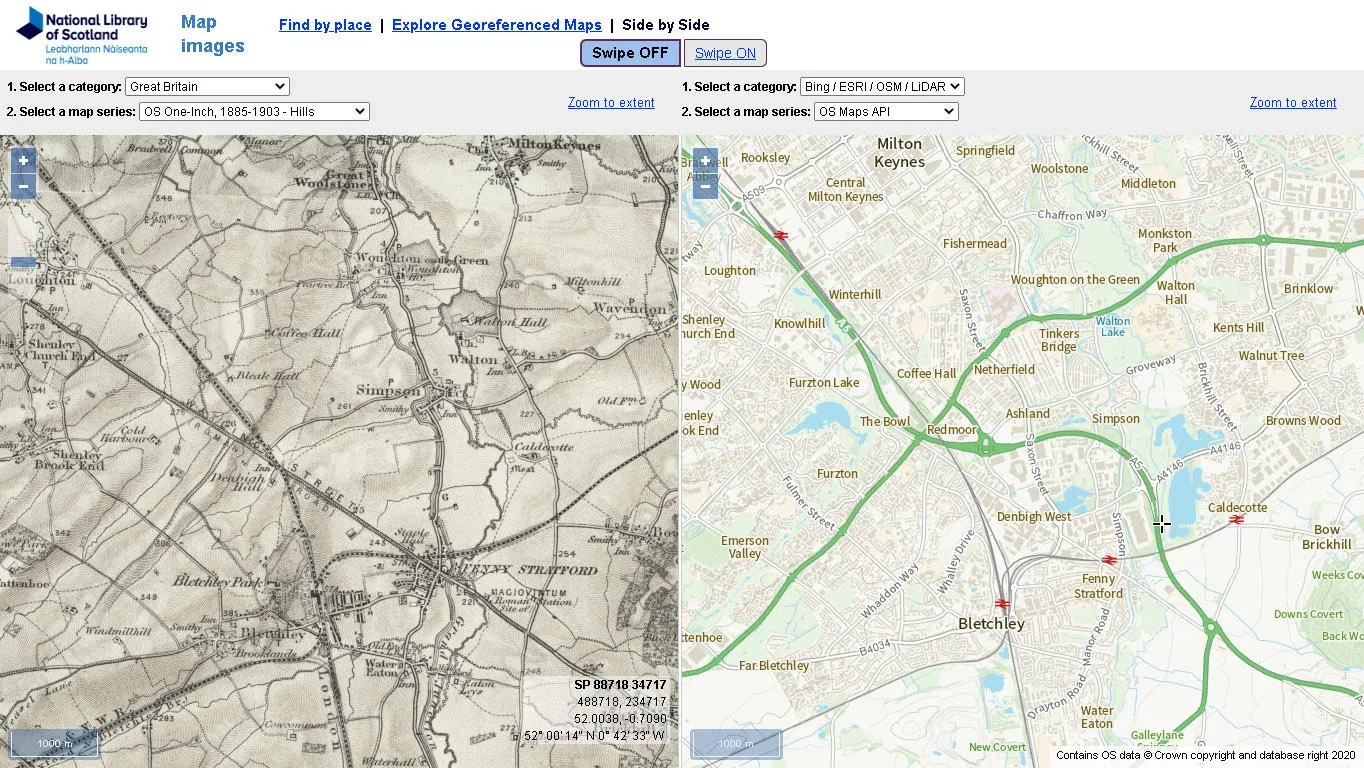
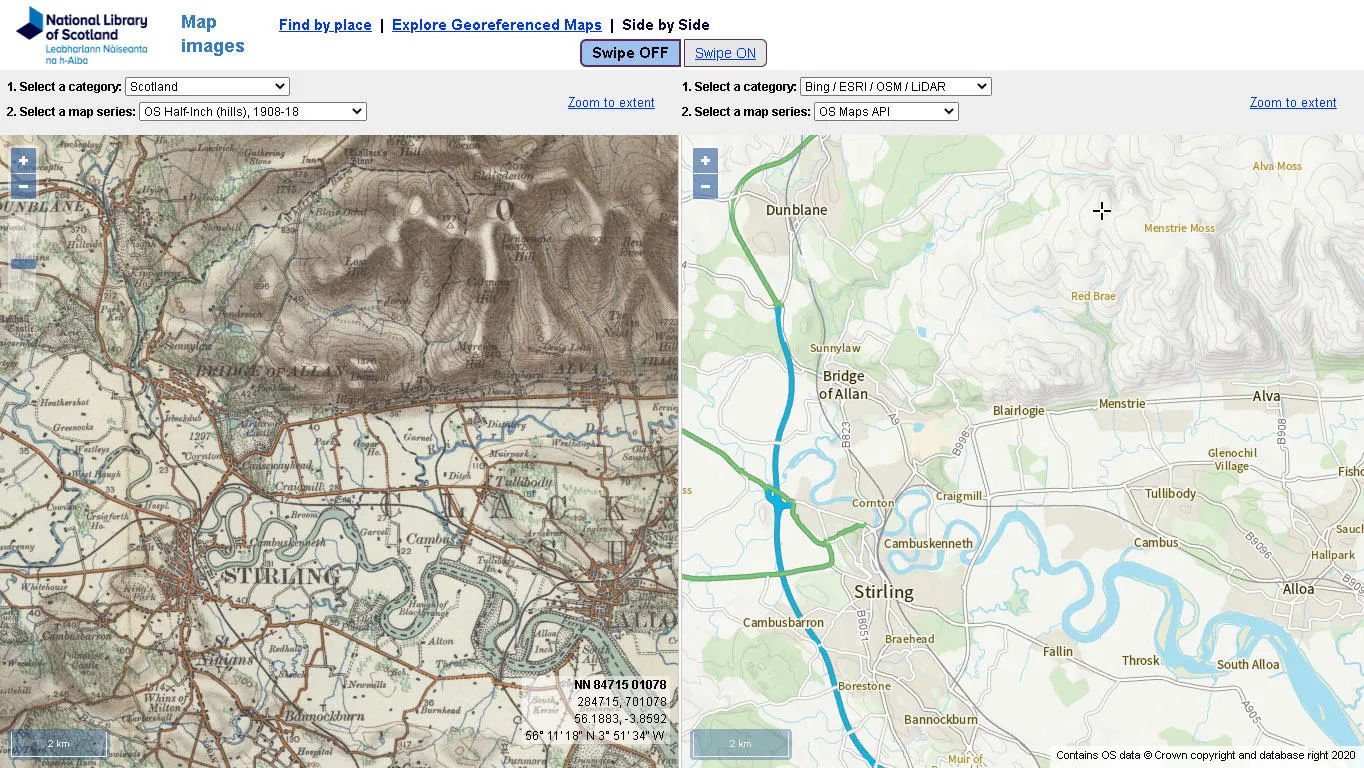
Once georeferenced, historic maps can be easily compared to present-day map or satellite imagery in a number of ways. The most obvious of these is using an overlay with a transparency slider, but it is also possible to use a split-screen Side-by-side viewer, or to compare things through a Spy-glass viewer. As one of our users has said, “the viewers are a great way of wasting hours and hours…”. With them you can compare landscapes of a century or more ago with the present day, and research a wide variety of subjects: urban expansion, travel and communications, archaeology, woodland history, place names, or coastal erosion, to name just a few. These are best illustrated by some of the examples below.
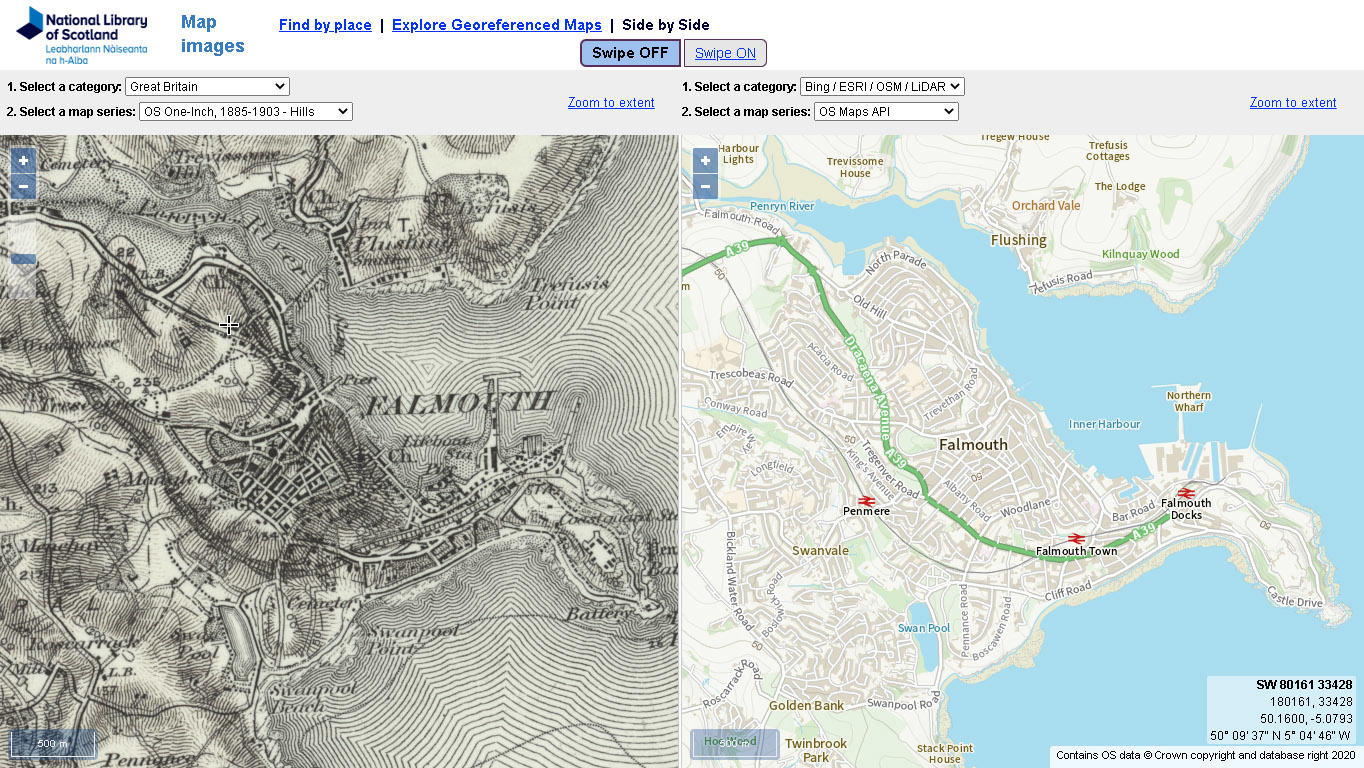
Historic maps also provide an excellent way of studying cartography too: the contrasting colour schemes, symbolisation, and aesthetic qualities of particular map series. We can marvel at the skill, labour and expertise that went into the creation of these historic maps, as well as be inspired by their beauty and artistry.
Maps are never simple facsimiles of the landscape, but much more interesting and intelligent selections and omissions from the real world, a process that inevitably reflects aspects of the society that created them. These historic OS maps illustrate changing attitudes to open space, to transport and travel, to recreation, to the economy and politics, as well as to censorship over time. From this perspective, maps provide much more than a window into the landscape, whether we are looking at a paper map from the 1900s or at the OS Maps API today.
How to use the OS Maps API
Incorporating the OS Maps API into a web-mapping application is thankfully a very straightforward process, as there are example viewers online for the most popular web-mapping applications: Leaflet, OpenLayers, and the ArcGIS API for Javascript.
The relevant Javascript code can be copied and pasted, with minor adaptations, into other web-mapping applications. It is possible to access the OS Maps API layer using the OGC Web Map Tile Service (WMTS) standard, or as an XYZ layer, and use the default British National Grid projection (EPSG:27700) or the global Spherical Mercator (EPSG:3857) used by Google, OpenStreetMap or Bing.
For NLS, we used the XYZ layer in EPSG:3857, adding a minZoom: 7 parameter so that it would display at lower zoom levels. The OpenLayers v4 statement for the layer was therefore:
var OSMapsAPI = new ol.layer.Tile({
preload: Infinity,
title: ‘Background map – OS Maps API’,
mosaic_id: ‘8’,
source: new ol.source.XYZ({
attributions: [
new ol.Attribution({html: ‘Contains OS data © Crown copyright and database right 2020’})
],
url: ‘https://api.os.uk/maps/raster/v1/zxy/Outdoor_3857/{z}/{x}/{y}.png?key=’ + ‘[API key]’,
minZoom: 7
})
});
Try it for yourself
If you are interested in using OpenLayers for creating similar web-mapping viewers to the National Library of Scotland, we have been keen to share information on this. All the code behind our viewers is available on our Github pages, with notes and comments. We have written blogs and more detailed articles on our different viewers for finding and making available historic maps, as well as published online workshops on Using OpenLayers to put historical maps online.
For those interested in georeferenced maps, we have also recently written about how we create and maintain our large historic georeferenced map layers, and it is also possible to re-use some of our historic georeferenced map layers on other websites, using our free Historic Maps API, or the fee-based Historic Maps Subscription API.
Stay up to date with our #OSDeveloper content by signing up for our newsletter.
Ready to begin?
Sign up to the Public Sector Plan to access all the data available under the PSGA via download or OS APIs
Sharing the latest news about OS. We can license you to use OS maps in print, online and film format. For more information and resources for journalists, bloggers and media professionals, email pressoffice@os.uk or call 023 8005 5565.
Products and solutions featured in this blog
OS Maps API
Accurate, up-to-date maps that offer the most convenient way to add detailed OS data to your application.
