A different perspective on the Highlands with OS OpenData
Guest blog by Alasdair Rae, University of Sheffield
Thanks to the new Ordnance Survey Data Hub, it’s easier than ever for users to get their hands on the treasure trove of geographic data covering the length and breadth of Britain. In this article, I’ll explain how I used some of Ordnance Survey’s digital terrain model data to create a new map of the Scottish Highlands. I will also say a bit about the software and methods, and I’ve shared the data below so anyone who is interested can try it for themselves. But before that, let’s take a look back at the first ‘3D map’ of the Highlands.
The first ‘3D map’ of the Highlands
Geography and history are inextricably linked, so it will come as no surprise that the origins of Ordnance Survey can be traced to the military imperative to map the Scottish Highlands – where I come from – in the wake of the 1745 Jacobite Rebellion. Shortly after, in 1747, the engineer and surveyor William Roy began his Military Survey of Scotland and it resulted in what has come to be known as ‘the Great Map’. It truly is a wonderful piece of science and art, and can be viewed in all its glory on the National Library of Scotland Roy pages.
Of particular interest to me is the way the hill shading on the map gives great depth to the Highlands and really brings to life the rugged terrain; from the towering peaks of Wester Ross to the high plateau of the Cairngorms. It also captured the Highlands at the beginning of a time of great change, when people living in many northern glens and shores were being forcibly evicted from the land in what we now refer to as the Highland Clearances. I mention this here because in my map I’ve tried to create a perspective that avoids conveying the impression of the Highlands as remote or bereft: they are very much the opposite!
Making a new map of the Highlands with OS OpenData
Whereas the Roy map involved years of hard graft, thousands of miles on foot and significant military backing, my attempt to map the Highlands has been conducted from my house in Sheffield, in a comfy chair, using free software, free data and a mouse and keyboard. But all the same, I hope you find it interesting. Here’s how I went about it.
- The first stage was to get the data. For this, I headed to the OS Data Hub. I then downloaded OS Terrain 50 tiles for the whole of Scotland. This data is designed for landscape visualisation and analysis over large areas and is a grid of elevation points with regular 50 metre spacing.
- Once I had the data, I merged all the tiles in QGIS (free, open source software), then I ‘clipped’ the file to the outline of Scotland to make it all nice and neat. I then compressed the file down from about 500MB to just under 16MB so it was easier to work with. You can find the file in this shared Dropbox folder.
- The next step was to visualise things in 3D. This can be done with a wide number of software applications, but I used a great free Windows tool called Aerialod that is specifically designed for creating height maps. I’ve explained how to do this on my blog if you want to have a go yourself – it’s a lot more straightforward than you might expect. The shared folder I linked to in the bullet point above also shows you the settings I used to render the final map.
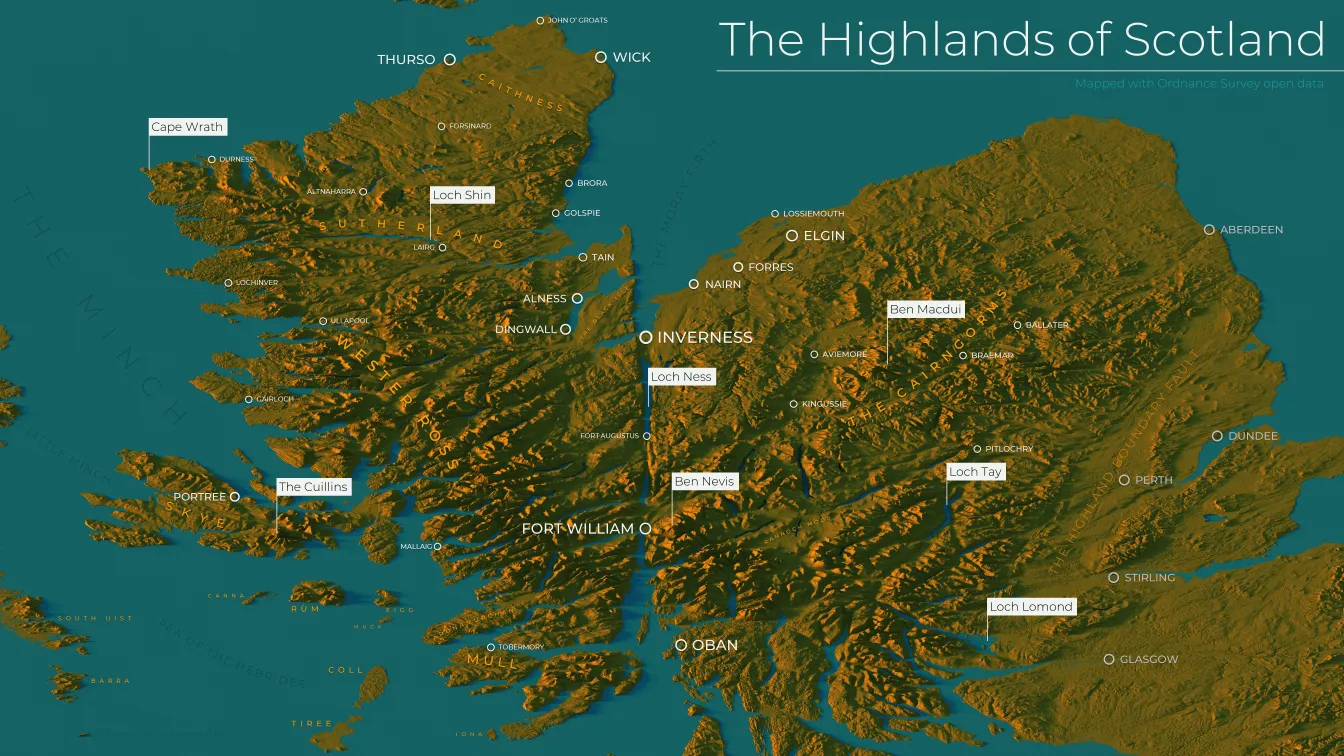
- I then spent quite a bit of time positioning everything, from the angle of the sun, to the way the light bounces off the hills, to the angle of the map. Talking of which, I chose an orthogonal camera view of the Highlands, looking straight up the Great Glen. This is an old cartographic technique, and may look slightly strange, but I wanted a view that put as much of the Highland terrain in the foreground as possible, and this was a good fit. I also exaggerated the elevation, to emphasise the topography.
- After that I just spent a few hours adding some place points and labels, in addition to a few markers for some lochs and mountains. I also labelled some non-Highland cities, for reference, as well as the Highland Boundary Fault, which more or less marks the edge of the Highlands.
-
Look closely for more detail
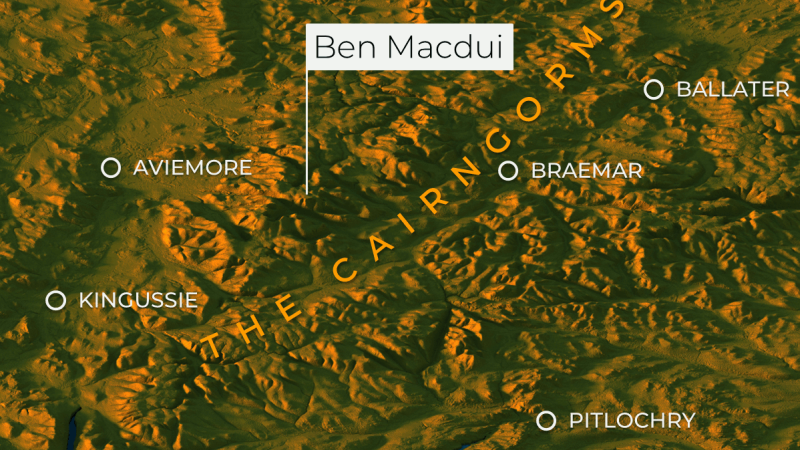
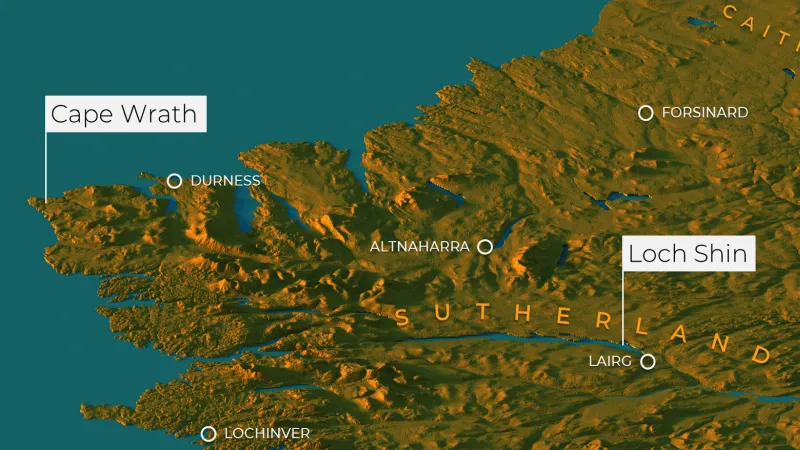
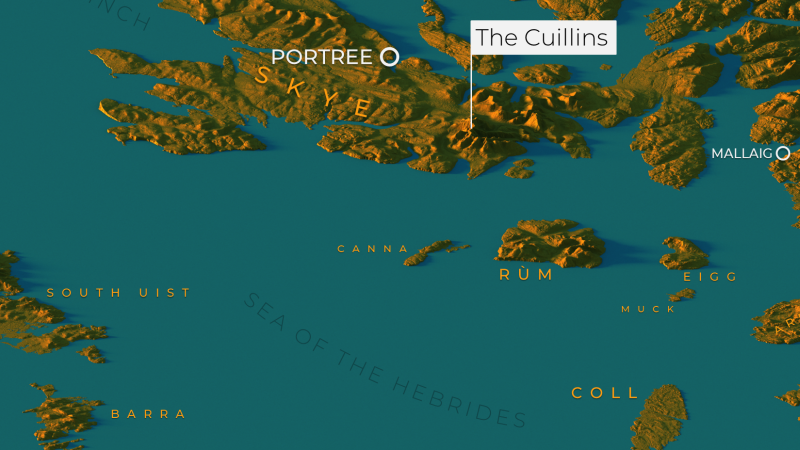
The final map should be considered a work in progress, and you’ll need to click on the full resolution version (OS Flickr page) to see the details, but I’ve extracted a few zoomed-in snapshots of the map here for easy viewing on smaller screens or phones.
The only thing left to say is that I encourage anyone with an interest in this to have a go yourself – the Ordnance Survey Data Hub is the perfect starting point!
OS Developer viewpoint
This is a fantastic and interesting series of spatial data visualisations from Alasdair. His use of the OS Terrain 50 digital terrain model – available via our Downloads API – and the open source tool Aerialod to create these relief maps is a creative use of OS data and illustrates what can be achieved with our high resolution spatial datasets.
If it’s inspired you to do something similar, you could use QGIS to create hillshade imagery of any part of Great Britain. You’ll find a whole range of products and APIs to try for free in our OS Data Hub.
See a more detailed version of Alasdair’s Highlands map, and more extracts from it on our Flickr page.
Find out more about how Alasdair created the map below.
Notes on the creation of the map from Alasdair
Places named on map: I didn’t include place names for everywhere, on purpose. I added the main places in the Highlands, plus a few smaller settlements for reference purposes, such as Forsinard.
Features on map – the white flags: again, I didn’t highlight everything, just a selection of interesting features that I like. I just chose a small selection of mountains and lochs plus Cape Wrath. The aim here was just to add a little more information without swamping the map. If you look closely at the high resolution map and zoom in you’ll also see other features labelled in gold text, such as the Ardnamurchan peninsula (Ardnamurchan Point is the most westerly point of Great Britain), Rannoch Moor, and the Black Isle (actually a peninsula, just north of Inverness), as well as some others.
The terrain looks exaggerated: yes it is and it is on purpose, to emphasise the topography of the Highlands.
The colours: I’ve tried to capture something of the colours of the Highlands in relation to the terrain and the way the sun shines on the hills at certain times of the day or year. It’s not supposed to be realistic but instead to provide a kind of hopeful glow effect that also emphasises the topography without casting too many long shadows.
The perspective of the map: the is an orthogonal camera view and, yes, it can look strange but I wanted to create something slightly different with this map. In this kind of view, unlike a typical perspective view of the world, the scale is not affected by distance from the camera so that places in the distance don’t become really small. It’s the kind of opposite of the effect we used to see for the Highlands in the old BBC weather map, for example. This was all part of trying to emphasise the the Highlands are not ‘remote’ or distant but very much the centre of the world!
What software was used to create this? It is Aerialod by @ephtracy. It’s a Windows tool for 3D visualisation of height maps and is available as a free download: https://ephtracy.github.io/index.html?page=aerialod – labels were added manually in another programme. Anyone interested can find out how to do it by reading my recent blog post on the topic.
Hey, my favourite feature isn’t labelled?! This isn’t supposed to be a definitive, finalised, authoritative map. The aim is to highlight the Highlands by using the freely available data from Ordnance Survey. The labelling and everything else reflects my own biases and perspective, but I have tried to create something that is visually interesting and also informative.
OS for developers
Whether you’re new to geospatial or a GIS data expert, our data platform grants access to our data

Our highly accurate geospatial data and printed maps help individuals, governments and companies to understand the world, both in Britain and overseas.
Products and solutions featured in this blog
OS Terrain 50
OS Terrain® 50 is an open height dataset of contours with spot heights, breaklines, coastline, lakes, ridges and formlines for Great Britain.
