New electricity pylons being added to the map
From phone boxes to pylons, there are 10,000 changes a day being captured in our database containing all of the features of Great Britain
It can be hard to grasp how that much change is taking place – until you think about all of the new roads and buildings under construction and then burrow down into the level of detail we capture – right down to phone boxes and even electricity pylons.
When National Grid announced that the first new electricity pylon design in 90 years was going to be erected in Nottinghamshire, we knew our surveying team would need to swing into action. Pylons not only feature in our large scale products, such as OS MasterMap for our business and government customers, but also in smaller scale products, like the 1:25,000 scale mapping in our OS Explorer maps used for outdoor activities.
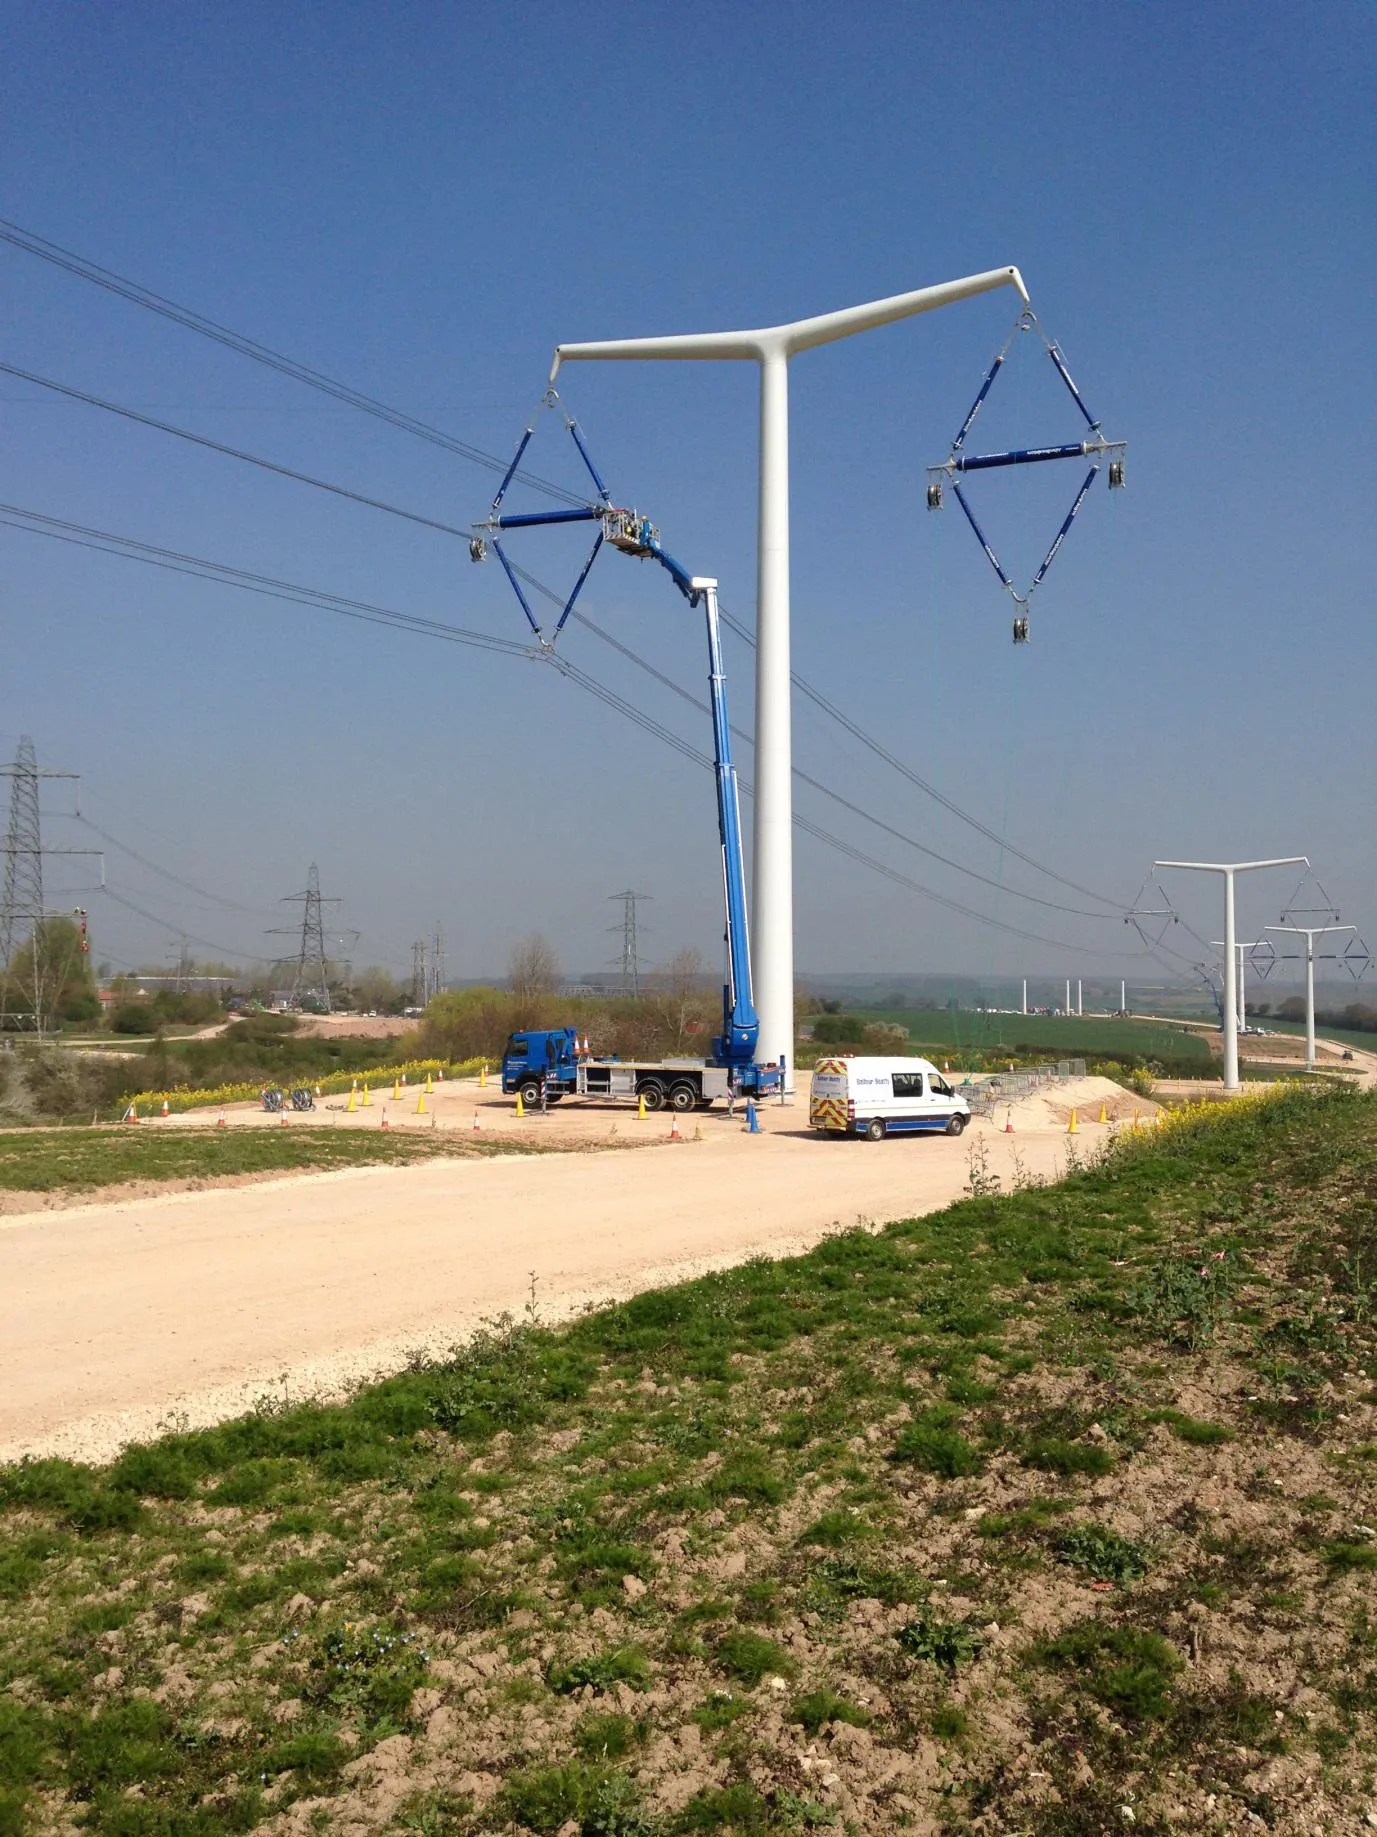
Chris Isaac at National Grid told us that the new T-pylons are shorter than conventional lattice pylons, measuring 36m against the 50m height of some traditional high-voltage towers. Although they are shorter, they are still capable of operating at 400,00 volts. The six T-pylons being built at National Grid’s training academy in Eakring will help the energy company better understand how to build and maintain the new pylon design. And while T-pylons won’t be replacing the hundreds of miles of existing lattice structures, with many proposed new low-carbon wind and nuclear power stations needing extra electricity connections across the UK, it will give National Grid another option to limit the effects of any new lines. The modern, sleek and slender alternative to traditional designs won’t be right for every landscape, but its shorter stature and ability to be routed in sweeping curves which follow land contours will offer an exciting alternative.
Our surveyor, Mark Southwart, covers the Nottinghamshire area and went out to capture the new pylons. The changes will be added to our next OS MasterMap refresh and then, over a period of time, be added into the smaller scale products such as 1:25,000 scale mapping. As the site is still under construction, Mark will also be heading back to the site towards the end of May to pick up the final changes for our maps.
How pylons are used on our maps by businesses
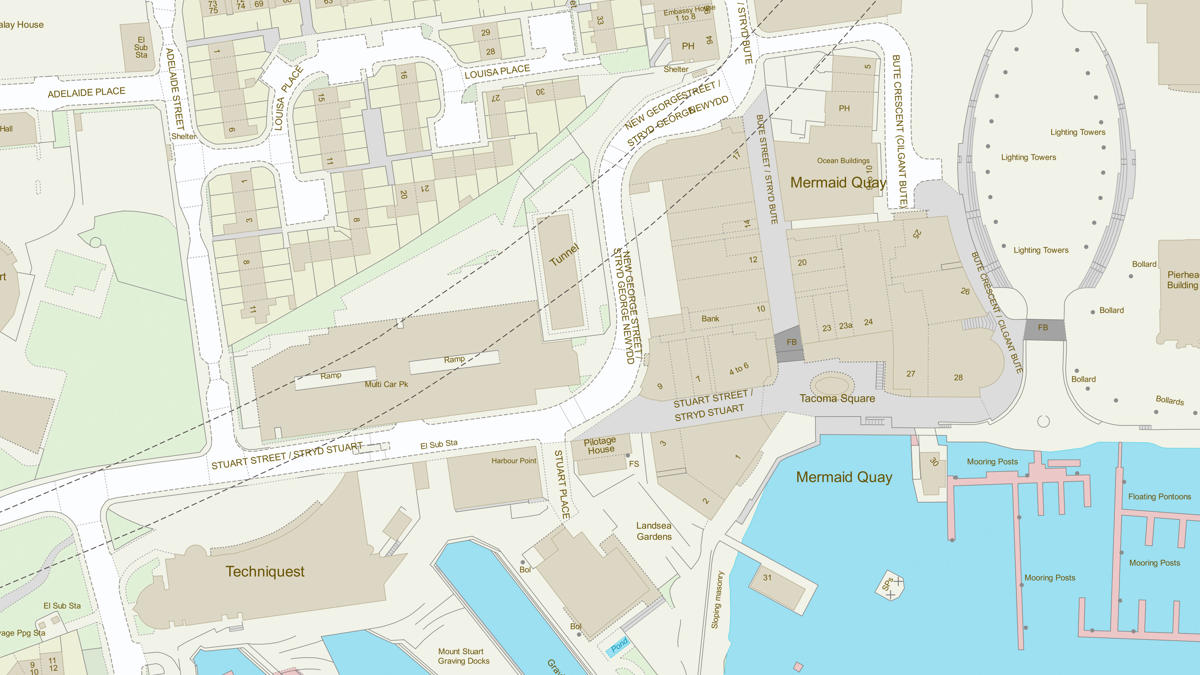
In OS MasterMap Topography Layer, our pylons are recorded as individual data features as in the extract of map below. The data is used by businesses to help make planning decisions, look at the impact of future buildings and much more. There are over 82,000 of them captured in our database, building a huge network of electricity being carried around Great Britain.
How pylons are shown on our paper maps
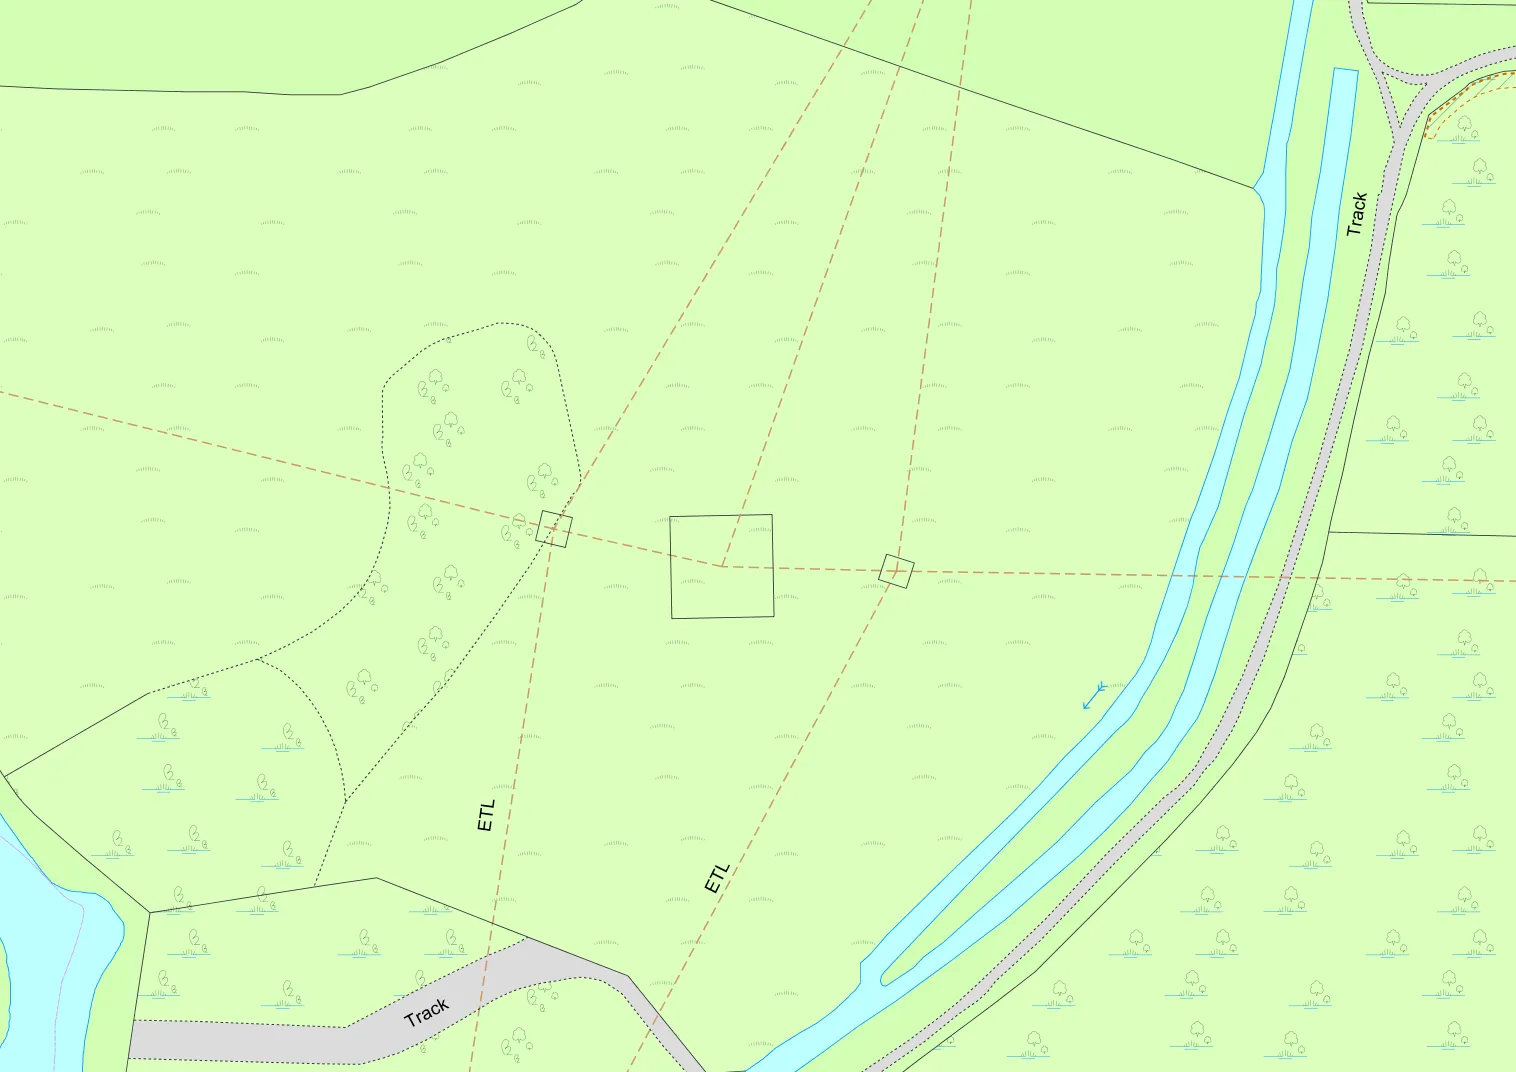
Currently we show pylons by a standard square symbol or to scale if larger. They are shown in their surveyed position; relative to other generalised detail. Electricity transmission lines that are supported by poles are shown by a dot symbol for the pole(s). The new style pylons are being represented as a pole so will be shown on Explorer maps as a dot symbol (so there will be no noticeable change to the mapping).
Sharing the latest news about OS. We can license you to use OS maps in print, online and film format. For more information and resources for journalists, bloggers and media professionals, email pressoffice@os.uk or call 023 8005 5565.
Products and solutions featured in this blog
OS MasterMap Topography Layer
A map dataset of Great Britain's landscape – from roads to fields, to buildings and trees, fences, paths and more.