Top 10 mapping moments in OS history
It’s been 225 years since OS was founded and 215 years since we published our first map
We've compiled our top 10 mapping moments that have recorded our nation’s evolving landscape, and helped us become the trusted geospatial partner we are today:
1. 1801 map of Kent
Our first map. We wouldn’t be here without it. Ordnance Survey’s original purpose was to create a map that would help our military to defend and protect a nation. England’s most south-easterly county, Kent, was the area most vulnerable to French invasion, so that was our subject – highlighting the county’s communication routes, and including elaborate hill shading to interpret the landscape precisely for those men at arms.
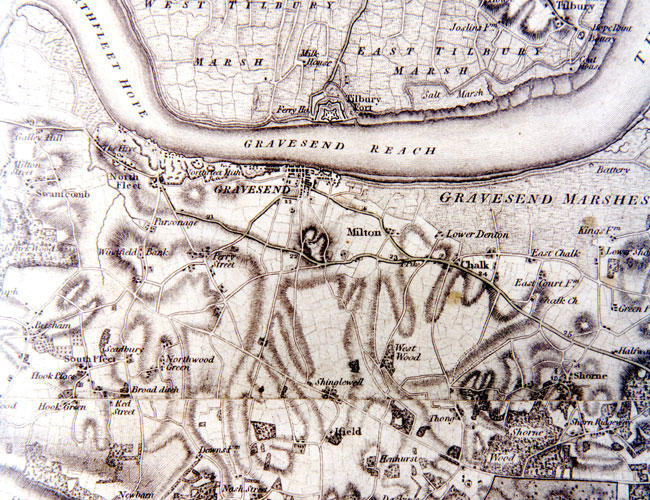
In time, this military focus would soften. Wider audiences came to appreciate and use our work. But our attention to detail has always been an asset to the armed forces: we printed 33,000,000 maps during World War I and an astonishing 342,000,000 for World War II. It wasn’t until 1983 that the last military personnel left OS, making us a wholly civilian organisation, and the War Department’s broad arrow remained in the OS logo for 21 years afterward as a nod to our military past.
2. Early leisure maps
Think of OS maps and many people think of OS Explorer and OS Landranger, with their familiar orange and pink covers. After World War I, we marketed OS maps to a new wave of outdoor enthusiasts. A professional artist produced eye-catching covers for our one-inch maps and Ellis Martin’s classic designs boosted those sales. The iconic drawings are still popular today.
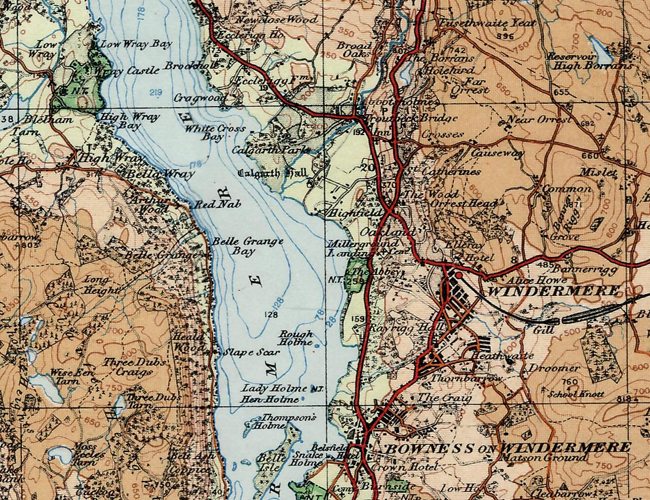
Experimental maps were produced just after World War II, with the idea that students could use them to learn about geography, and by the 1970s we’d purposefully published our first Outdoor Leisure map. These early publications defined the maps we publish now to help people #GetOutside – there are 607 paper maps in the Explorer and Landranger series, all with a digital download.
3. Aerial imagery
We’ve been using aerial photography to carry out our surveys for almost 100 years. Originally, this had the advantage of capturing information from areas that surveyors found hard to visit on foot. Today, it means we can on top of the data capture process – making continuous revisions of the whole nation’s landscape – and it may not be long before we’re surveying from the air with a range of unmanned aerial vehicles too.
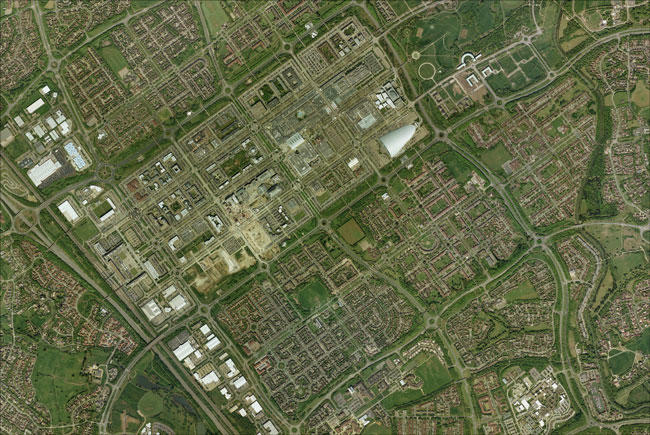
At the moment, our in-house Flying Unit works with contractors to photograph around one-third of Britain every year – or 80,000 square kms of Britain’s urban, rural, moorland and mountain terrain. This imagery a key component in many of our mapping databases and products. We capture it using leading edge airborne sensors and the data is processed at our head office in Southampton – where it becomes the essence of OS MasterMap Imagery Layer.
4. International maps
The Ordnance Survey Overseas Directorate was formed in 1946, although we’d been involved in international mapping for much longer: we surveyed Jerusalem (helping the city to improve its water supply) as early as 1865. As well as mapping many British colonies and protectorates, and some non-Commonwealth countries, our Directorate provided advice to foreign governments on all aspects of surveying and mapping. The Directorate closed in 2001, when the surveying and mapping archive passed to The National Archives at Kew.
Today, we still help customers all over the world to develop and grow their geospatial capability. Ordnance Survey International was formed in 2012 to share our expertise in creating policies and shaping strategy; to advise on geospatial data capture, product development and marketing and more. OS colleagues can be found today working on four continents, helping organisations of all shapes and sizes to develop their geospatial capacity and capability.
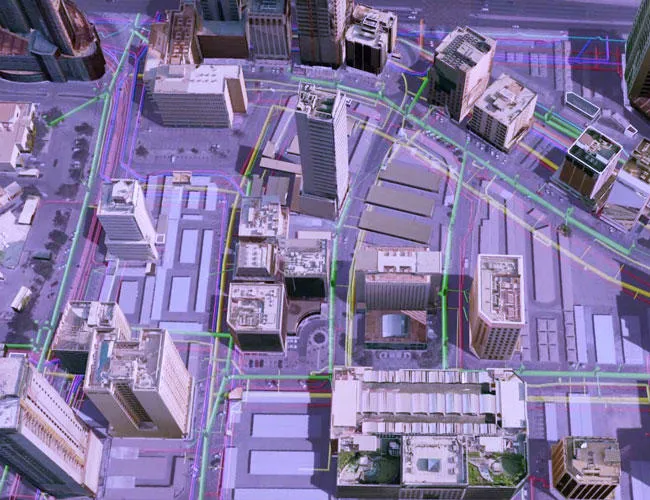
5. OS MasterMap
Launched in 2001, the OS MasterMap database contains over 500 million geographic features. The topography layer is the most detailed and accurate view of Great Britain’s landscape – from roads to fields, to buildings and trees, fences, paths and more.
Being able to interrogate and analyse a digital dataset of geographic features feels lightyears beyond the first OS map of Kent, a picture of the landscape some 200 years earlier. But for businesses in a modern world, it’s an ideal way to put things in context: providing the confidence to make location-based decisions about assets, services, environmental risks, customers and operations.
6. OS Open Map – Local
In 2010 we launched OS OpenData, making a range of OS data available for free for the first time. We’ve seen hundreds of thousands of downloads and orders of the data, with it being used in myriad ways, particularly with electoral boundary information and postcode data.
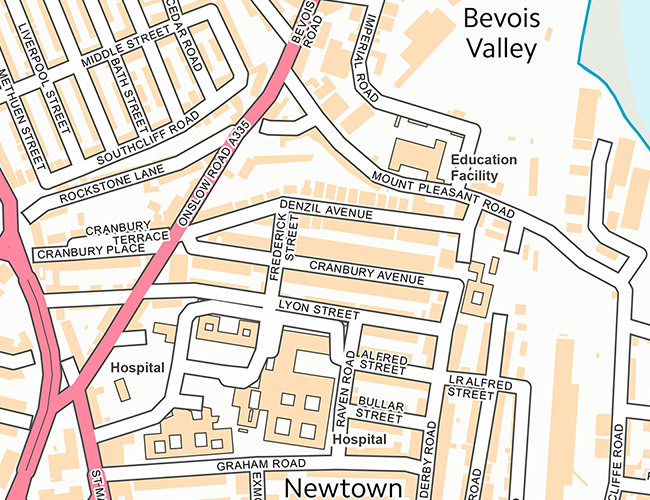
Five years later, in 2015 we launched our most detailed open dataset, OS OpenMap – Local. This works with the latest mobile and web platforms, letting developers build new products with some of the most sophisticated mapping data in the world. It makes us proud to know we’re helping Great Britain develop a reputation for being one of the most advanced open data societies in the world. This approach – transparency, accuracy, and sharing knowledge – should generate opportunities for enterprise, drive innovation in the digital economy, and increase demand for new apps and services to help data-driven businesses prosper and flourish.
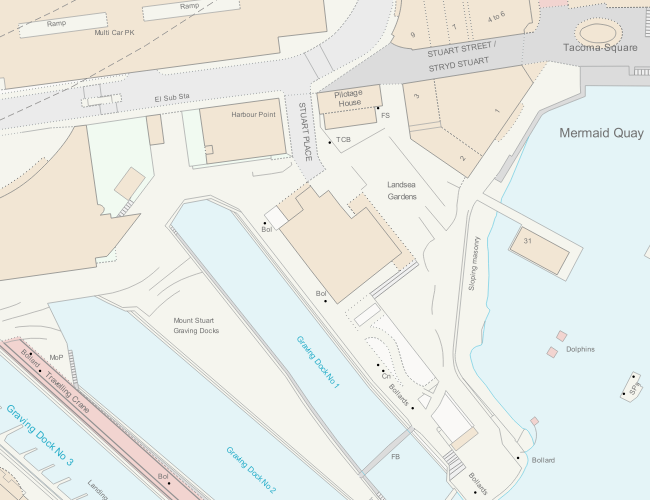
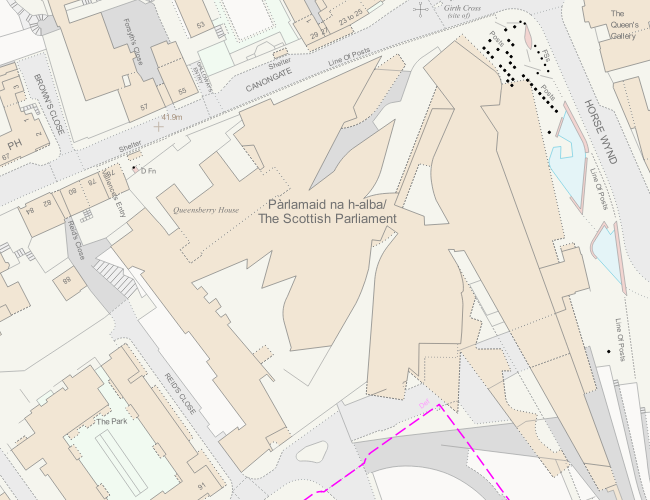
7. Mapping prestige sites
From putting the M1 on the map in the 1960s to surveying the Scottish Parliament, we’re often called on to capture venues or infrastructure developments that are important to the nation, before they’re opened to the public or officially unveiled. In 2012, our geospatial data supported the safety and security arrangements of the whole Olympic Games, in addition to being used to display event locations.
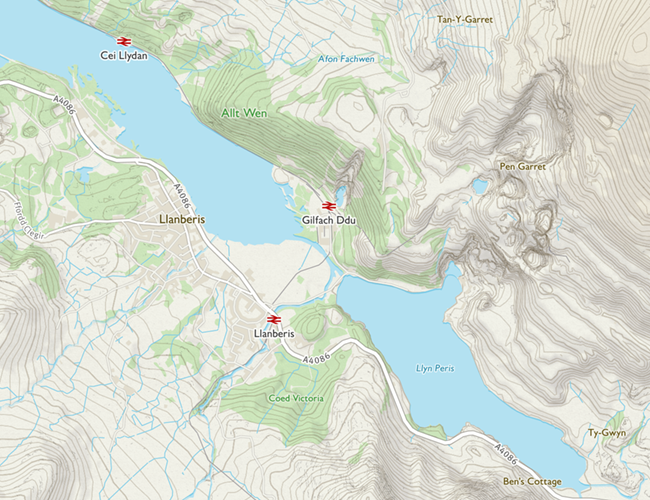
8. Digital maps for the web and mobile era
OS Maps combines our cartographic heritage with the clean aesthetic of modern web maps. We apply a visual texture to the online version, which we believe helps bridge the gap between using a paper map and gathering the information from a phone or a tablet, perhaps. Using shadows on buildings and water add depth; woodland areas have individual trees that designate coniferous or deciduous woodland. By combining the best elements from our OS Explorer map data with the best of modern cartography we’ve achieved a fantastic blend of the traditional and modern map worlds. Already available on our OS Maps service for web and mobile, it will also be available in the OS Maps API for customers and partners to develop their own applications.
9. Minecraft map of Britain
In 2013, we used OS OpenData to recreate the map of Great Britain in Minecraft. It’s the only OS map to win a place in the Guinness Book of Records (as the largest real-world place represented in Minecraft). Originally created with 22 billion blocks representing the 224,000 square kilometres of our country, we updated the map in 2014 with more detail, taking it to a staggering 83 billion blocks. Joseph Braybrook, creator of the map, used 1:25 000 scale OS VectorMap District for a smoother, more expansive appearance that is closer to real life.
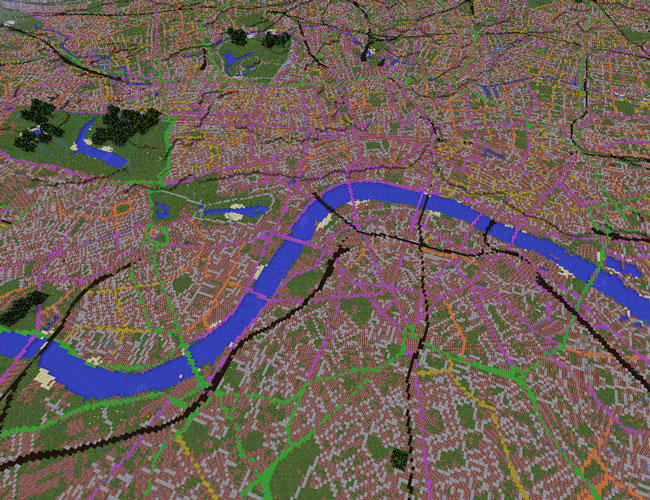
With over 100 million registered users in the Minecraft community, there is always demand for new uses for the technology. The map has been highly praised by parents and teachers for being a way of engaging children in learning about geography. We even inspired the Danish and Northern Irish governments to produce their own Minecraft maps. Generating tens of thousands of downloads, the Minecraft map is just one example of how freely available location data can support innovative projects.
10. Mapping Mars
After 225 years mapping Great Britain, and experience of mapping internationally, this year saw us take OS mapping out of this world. Using NASA open data, we created a one-off paper and digital map of the Martian landscape. We were asked to map an area of Mars in an OS style because our maps are easy to understand and present a compelling visualisation: because of this we can envisage their usefulness in planning missions and for presenting information about missions to the public.
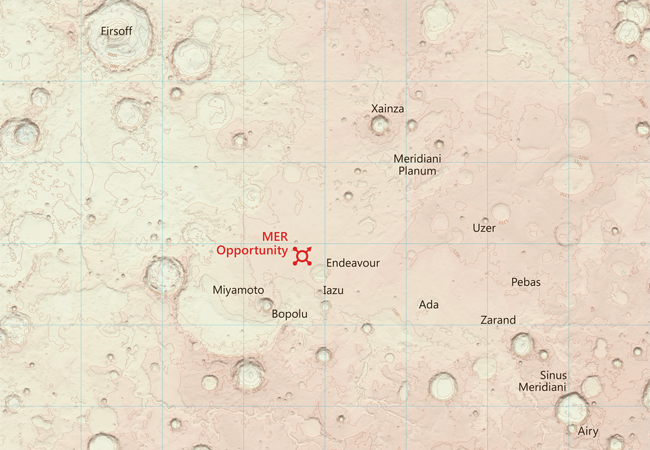
The new map covered a 3672x2721km extent of the Mars surface and was produced to a scale of 1 to 4 million. It reflects the fact that the depth and breadth of data we produce has no equal. It is used by governments, companies and individuals in keeping the nation, economy and infrastructure moving. It is data so big, yet simultaneously so granular and accurate that the location of every fixed physical object in Great Britain, from the ground upwards, is registered. We began our work 225 years ago. Since our humble beginnings, surveying the county of Kent, it’s been quite a journey.
What do you think? Which maps would you include in your top ten? Share your thoughts with us on Twitter.

Our highly accurate geospatial data and printed maps help individuals, governments and companies to understand the world, both in Britain and overseas.