Geographic Data Visualisation (or GDV for short) is the process of displaying geographic information in a way which is easy to interpret, aesthetically appealing, and accessible for different users.
Paul Naylor and Jess Baker – our GDV experts at OS – have compiled some of their favourite tips and resources to help you when visualising OS data.
GDV toolkit
Styling a dataset from scratch can be a daunting task, which is why we’ve compiled a toolkit with lots of resources to help you get started. Whether it’s colours schemes, principles to follow for good cartographic design, or icons to use on your next map – you can access them here: https://github.com/OrdnanceSurvey/GeoDataViz-Toolkit
Styling
Many OS datasets can be given a contextual style, to turn them into a contextual map which can be used in your GIS software. We’ve taken the pain out of creating those styles by providing a range of cartographic styles for you.
Choose from Outdoor, Road, Light, Backdrop, and Standard – see which styles are available for each product on our GitHub, with accessible options for other OS products coming.
We’ve also created some custom stylesheets for the OS Open Zoomstack product, specially designed for different types of colour blindness, these can be downloaded from our GitHub site.
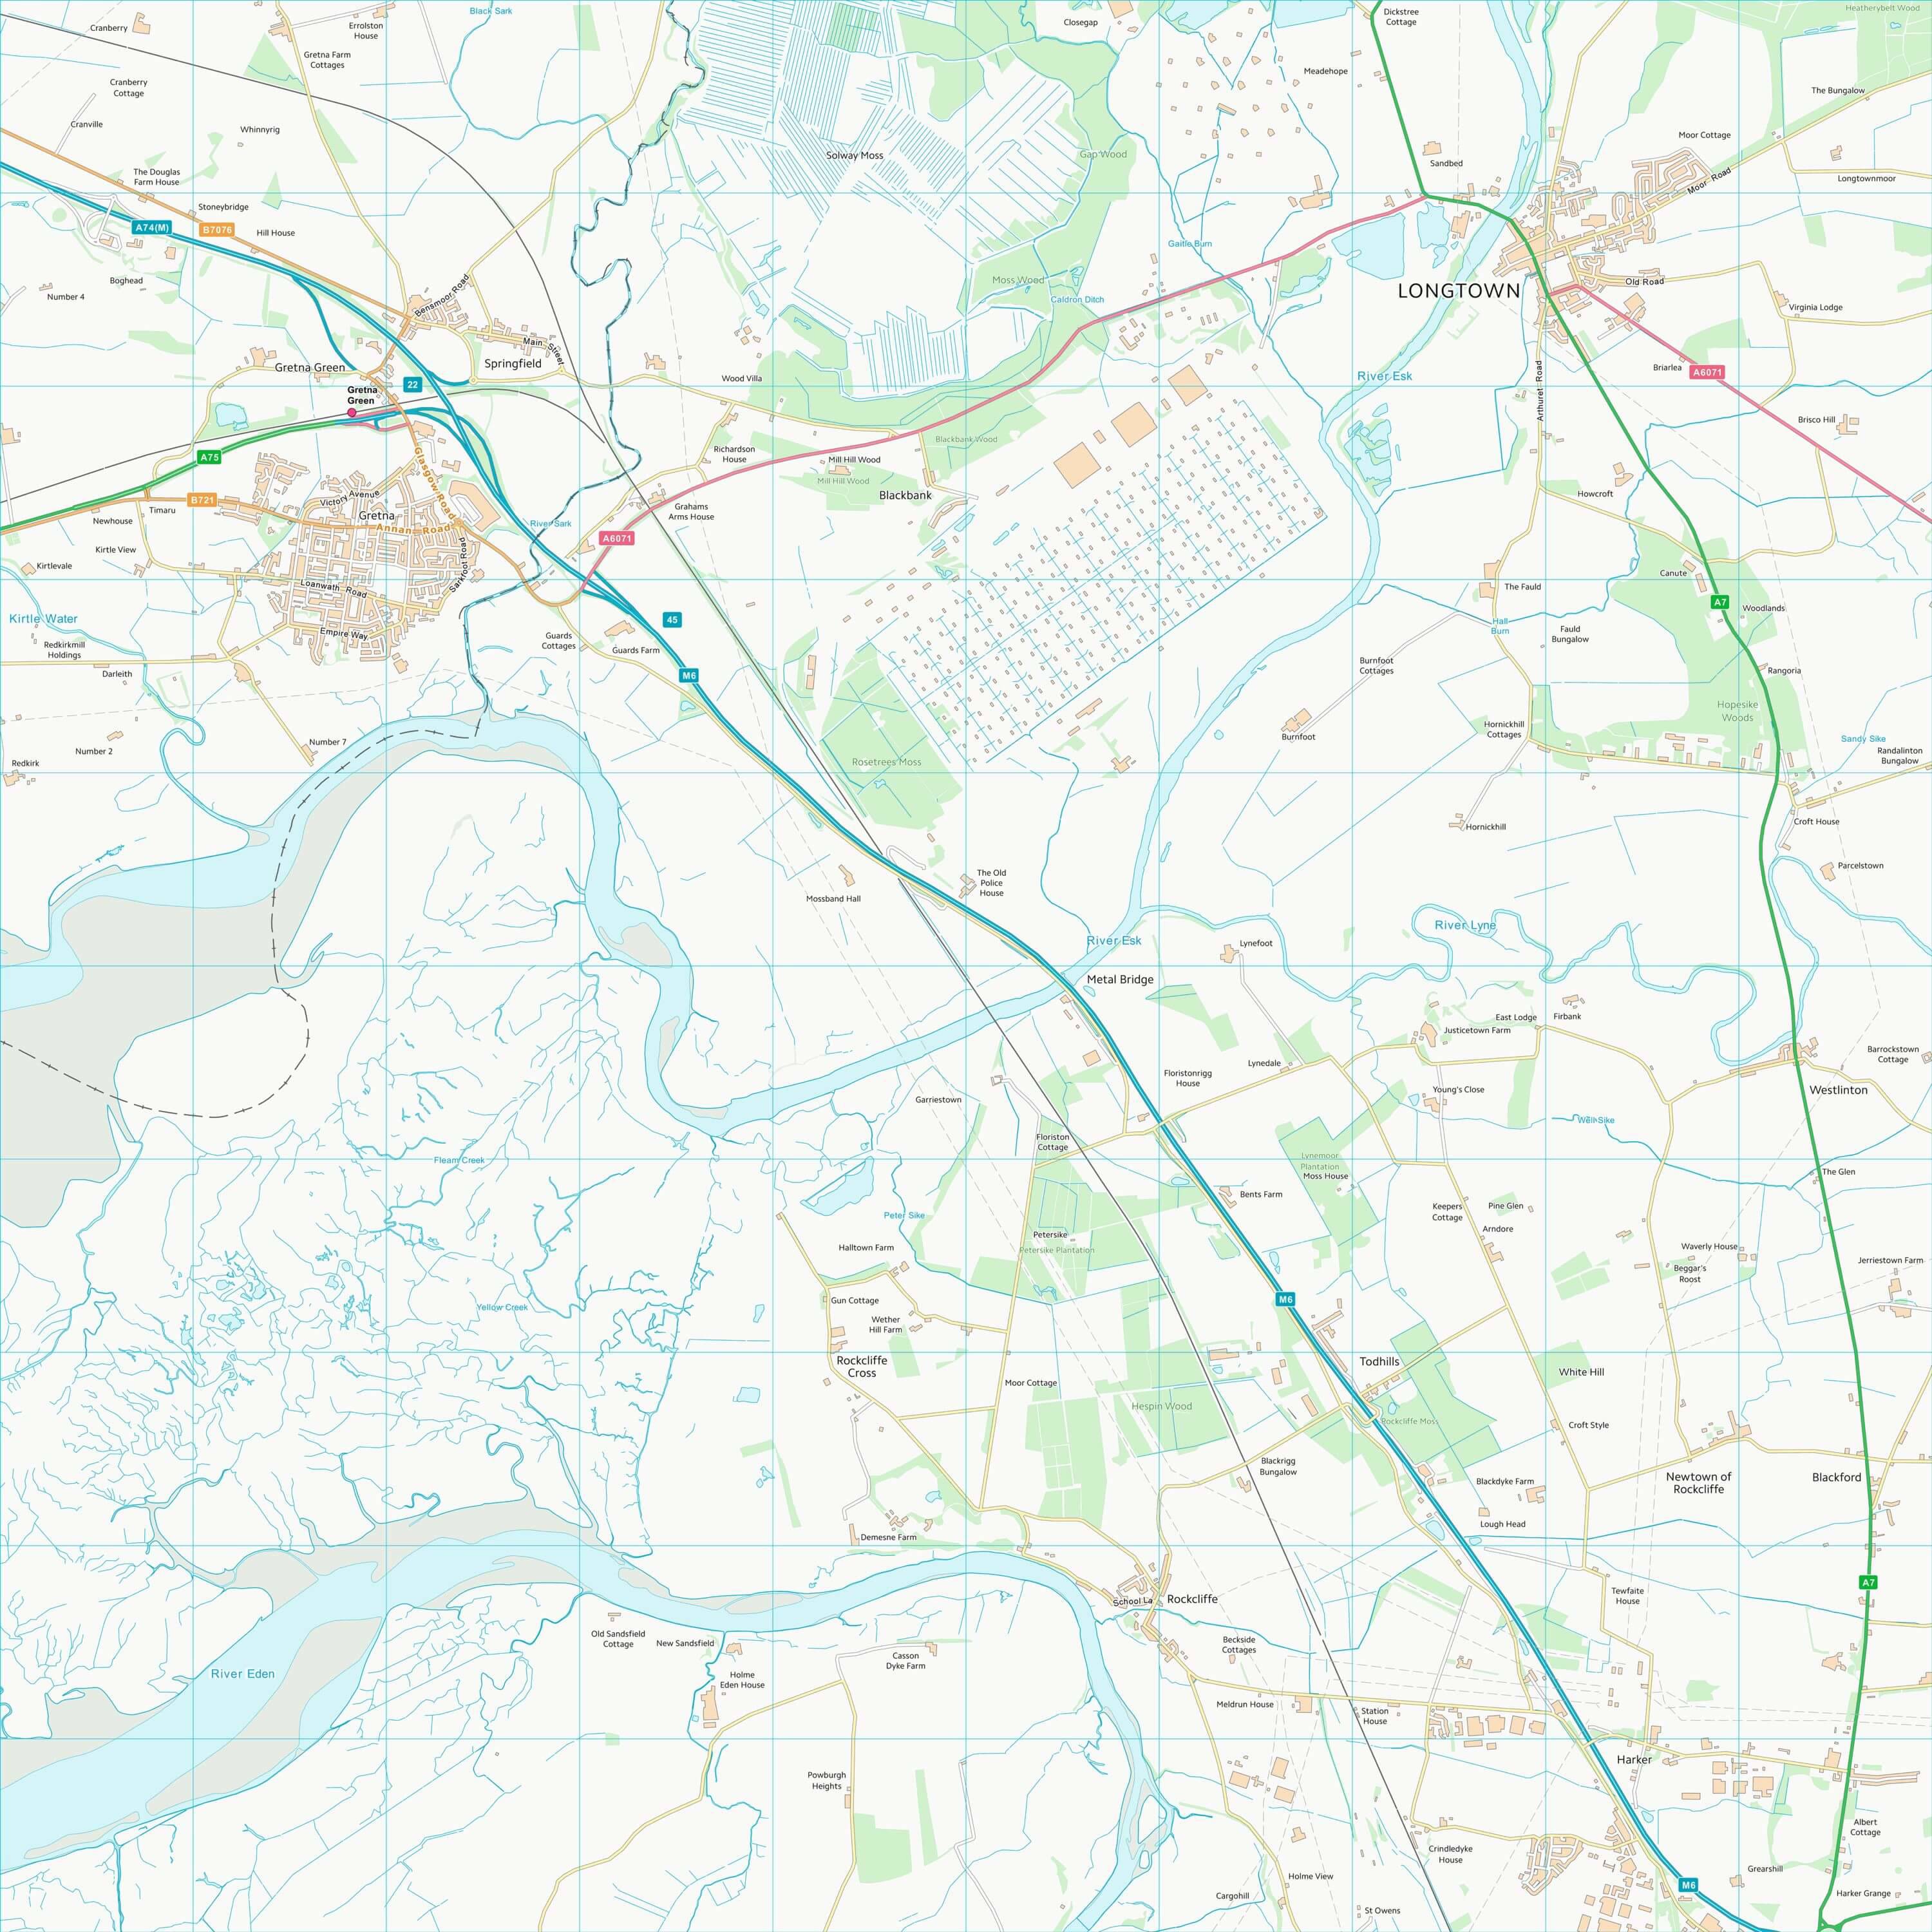
Using an OS API as a basemap
The OS Maps API and Vector Tiles APIs are perfect for lightweight, detailed and cartographically beautiful backdrop mapping in your preferred GIS software. Find out how to integrate them into your next map or GeoDataViz project.
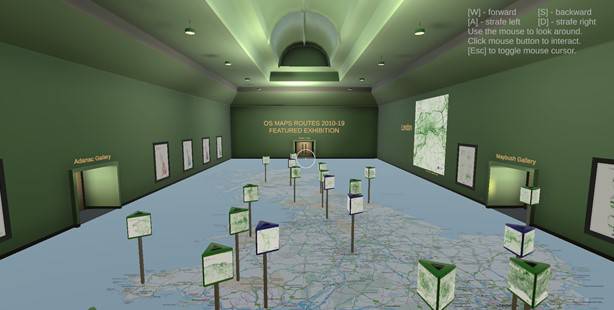
GDV Gallery
In search of some inspiration for ways to visualise data? Or just want to look through a catalogue of some of the recent GDV projects at OS? The OS GDV Gallery is an interactive museum-style gallery of many different data visualisations, or head to our Flickr site for the still images.