Using OS's new buildings data attribute: number of floors
Create a quick and simple 3D visualisation using new detail on the physical structure of buildings
Ordnance Survey (OS) has included data on the number of floors in buildings, in our latest release of the OS National Geographic Database (NGD).
OS NGD data and features
The OS NGD delivers nationwide, structured data. It contains information on physical features, and notional features – such as a boundary line – creating geospatial relationships between them. These spatial, attribute and temporal relationships help us understand how these features relate to each other in the physical world.
Data within the OS NGD is hierarchal, separated into three different layers:
Themes:
A theme is a macro grouping of features that represents similar geographic entities, and are the highest grouping within OS NGD, such a building or an address.
Collections:
A collection is a sub-grouping of the OS NGD themes. Collections group together similar types of data within a theme such as our networks data, which is separated from topographic features.
Feature types:
A feature type is the most granular grouping within the OS NGD. Feature types have their own data model and specifications and is the layer where the data is accessed. Each feature type contains attributes that you can access. It contains descriptive properties that describes a feature. Examples of attributes are an identifier, geometry, or source information
Buildings data and 'numberoffloors'
Both Themes and Collections are groups for easy-to-understand concepts. As an example, if you wanted to understand potential risks of living in high-rise buildings, you would need information that has derived from the conceptual groupings for addresses and buildings. The access method is within the OS Data Hub; a tool called OS Select+Build, using the structure of groupings to drill down to the data you need.
Within OS NGD, there are many feature types within the grouping of buildings data. Our ‘Building’ Feature Type contains details on the number of floors in both residential and office buildings. The release compliments existing features such as height attribution, found in the Building Part Feature Type.
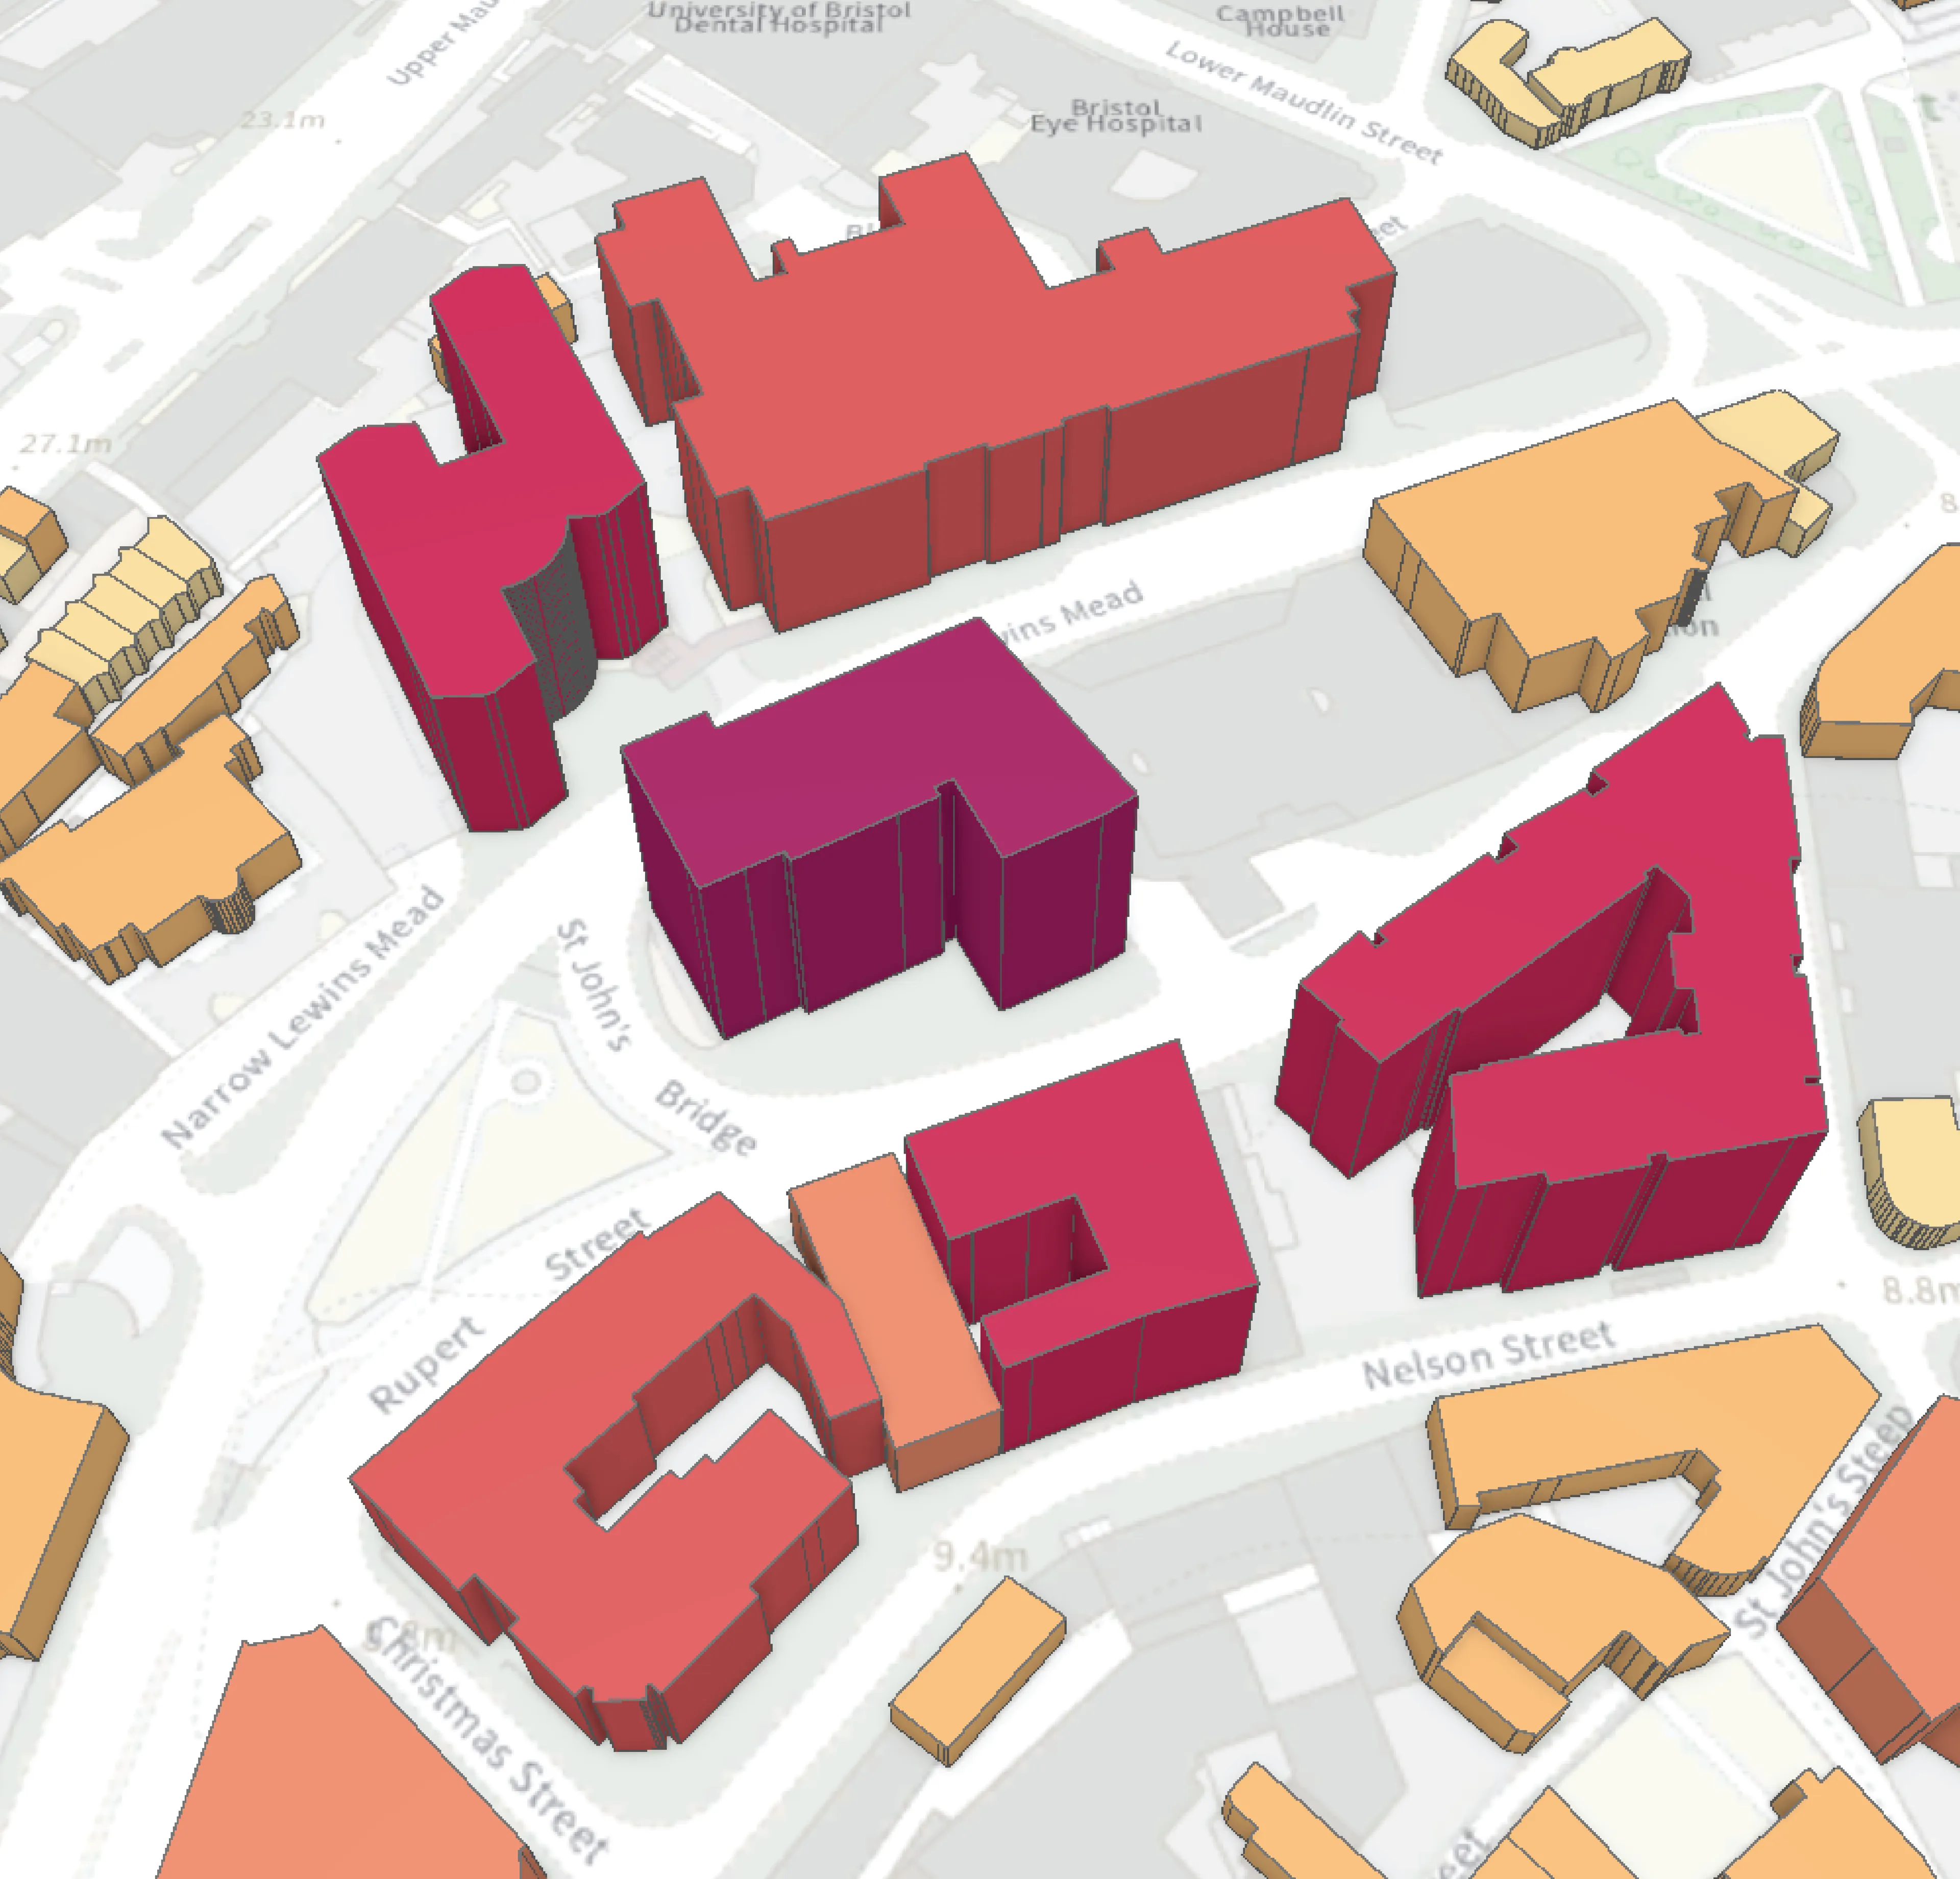
The ‘numberoffloors’ attribute is populated for the whole building, not its parts. This provides a quick visualisation of approximate height in a GIS, and allows you to easily show buildings with large numbers of floors. You can even colour-code buildings accordingly, as shown in this example:
The data can be used to support building standards and regulations, as well planning for large scale events. It can also be used in emergency aid and response, to identify a person within a high-rise building who requires additional support. OS has built the data to support emergency services, and for anyone involved in the management and the reporting of sustainable assets.
OS NGD data can be loaded into other platforms and used alongside other data for different types of analysis.
Create your own ‘numberoffloors’ visualisation
These visualisations were made in ArcGIS Pro in three simple steps:
1. Creating a new Scene in ArcGIS Pro and loading in one of our APIs as a basemap and the new OS NGD Buildings: Building data
OS Maps API in the Light style was used due to its suitability for backdrop mapping and overlaying data – for more details see: ArcGIS Pro | OS APIs to add an API to a GIS project. OS NGD Buildings data can be downloaded from the OS Data Hub.
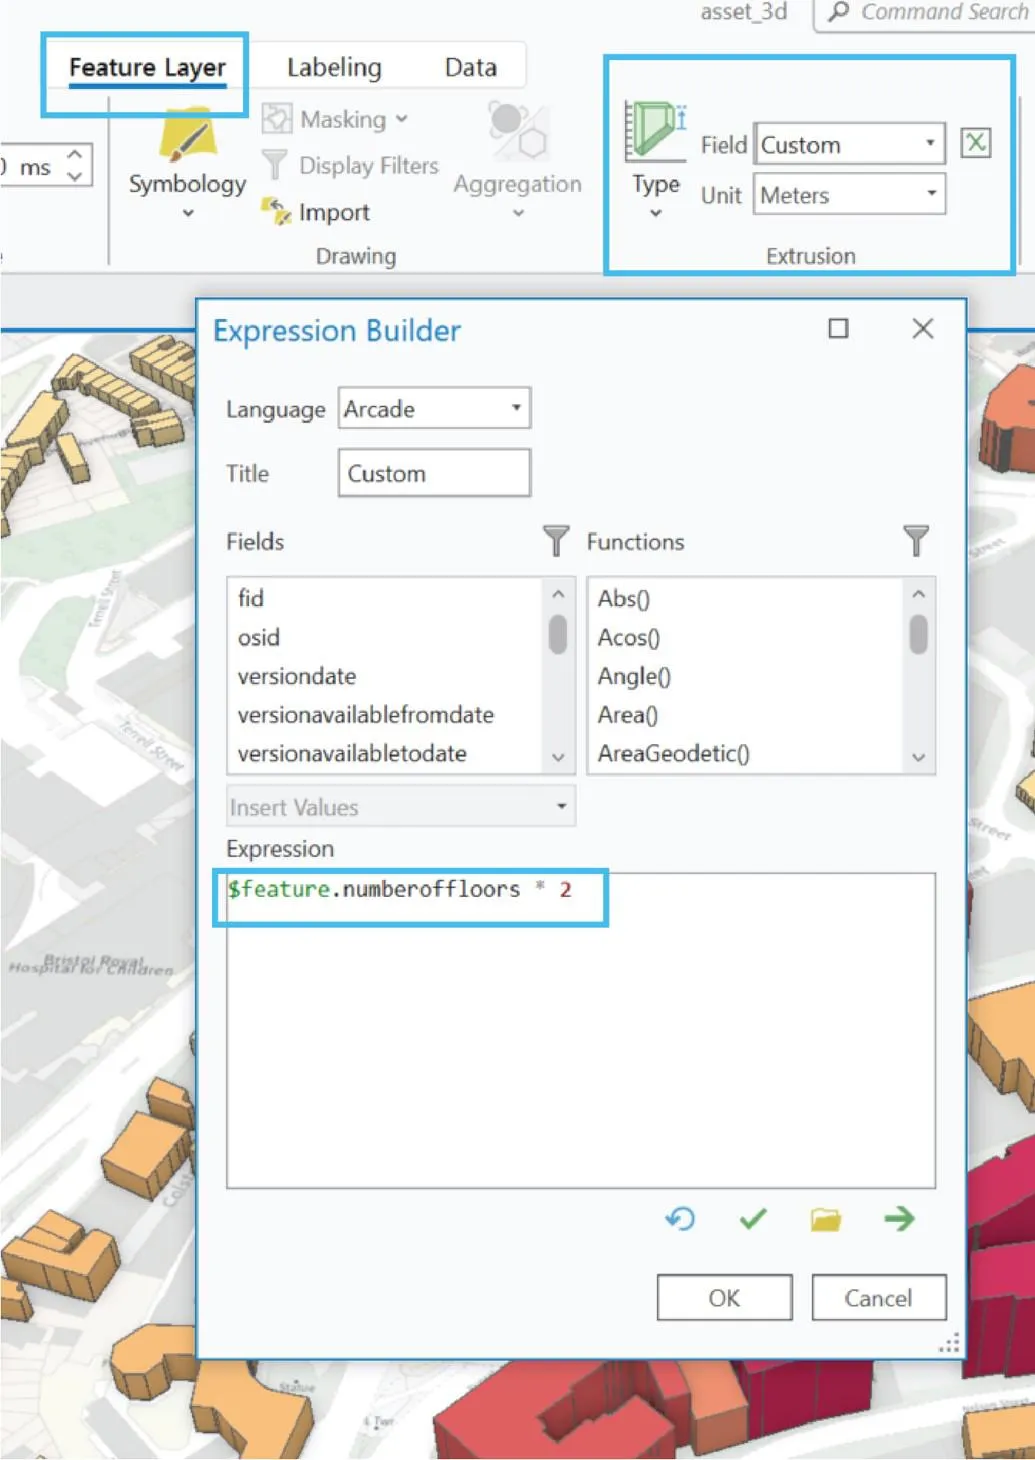
2. Extruding the building polygons by numberoffloors
A simple way of visualising the buildings in 3D is by clicking the layer, going to the Feature Layer panel and setting the extrusion type as ‘Absolute Height’, the unit as metres and the field as a custom value. This can be set to any field with a height value (for example relativeheightmaximum in Building Parts for actual heights) but for a simple visual (numberoffloors * 2) gives a good result to show buildings with an approximate 2m per floor.
3. Creating a layout to export as an image
You can change the perspective of a scene and pan around the data and export a layout view you are happy with, whether to display further data or simply to visualise how the number of floors per buildings varies in a location.
Try out a simple 3D visual yourself by following these steps. 3D extrusion using numberoffloors as an attribute is also possible in QGIS and other GIS or 3D software if you would like to explore the data with alternative methods.
Create more data visualisations
Data visualisation tells a story. It brings data to life. It allows you to drive actions and decisions and spot patterns, trends, and outliers. What could be presented as a basic spreadsheet can be visualised in a way that people can understand. It makes data accessible, allowing you to turn very complex data into compelling and understandable visualisations.
It uses a variety of graphic outputs such as maps, charts, and infographics, to help showcase and tell stories with our data, and unlock valuable insight and observations related to the geography of Great Britain.
We can support you in visualising data from the OS NGD in its purest form, and enable our location data to be visualised for more complex analysis.
Access OS NGD data via the OS Data Hub
PSGA members and OS Partners can get direct access to the OS NGD through the OS Data Hub using our download service OS Select+Build, OS NGD API – Features and OS NGD API – Tiles.
OS Select+Build and OS NGD APIs are available through the Public Sector Plan and Premium Plan on the OS Data Hub through the existing pricing and licencing frameworks for each plan.

Our highly accurate geospatial data and printed maps help individuals, governments and companies to understand the world, both in Britain and overseas.