The benefits of vector tiles
Fast, customisable, versatile web maps.
Web mapping has come a long way since the first map server was built in 1993 at the famed Xerox Palo Alto Research Center. Since then, users have come to expect intuitive, beautiful and instant maps on their desktop and mobile devices.
Why tiles?
The typical modern map user accesses map data on devices that usually don’t have the storage capacity for high resolution maps of the entire world. Instead, apps and websites show mapping data that is served as needed over the web.
When a web map is loaded, it is set to a zoom level and extent, which defines the level of detail and the area that will be visible in the viewer. A map server sends grid sections of the map, called “tiles”, to the user, where they are arranged in the right configuration to appear as a map. As the user pans and zoom in and out, requests for the correct tiles are sent, and the response is used to update the screen.
Raster and vector
Location data comes in two broad forms.
Raster data represents space as grids of regular pixels. By assigning each pixel in the grid a value — or a few values — images can be described with numbers. This is useful because it means images can be represented, processed and stored by computers as bits or binary digits.
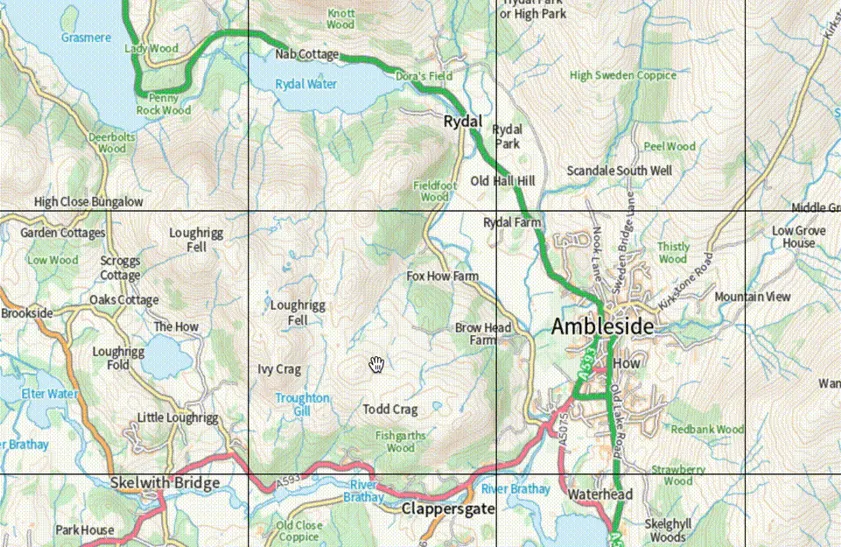
A raster tile service like the OS Maps API serves binary data representing these raster (png) images to a mapping client, where they are processed and displayed on the screen for the user.
Raster tiles are created by rendering a dataset of spatial vector features on the server based on a style – in our case, a style designed by OS cartographers.
So – what is vector spatial data?
Vector data is a bit different, but in a subtle way. Rather than representing space in a regular grid, entire geographic features are represented mathematically. Points are stored as x,y – or longitude, latitude – coordinate pairs; lines as arrays (or sequences) of coordinate pairs; and polygons as sequences of coordinate pairs that end where they start. For lines and polygons, each coordinate pair represents a vertex, or corner, of a shape. These sequences of numbers can represent geographic features like rivers, buildings or rail stations at a range of resolutions.
Feature types are organised in layers. For example, a layer of LineStrings might represent railways, while another might represent country borders. The feature type is described in the layer metadata, enabling web mappers and data scientists to identify what each feature represents, and style or analyse it accordingly.
Just like with raster data, vector data can be represented in binary, and therefore stored and processed by computers.
Vector tiles
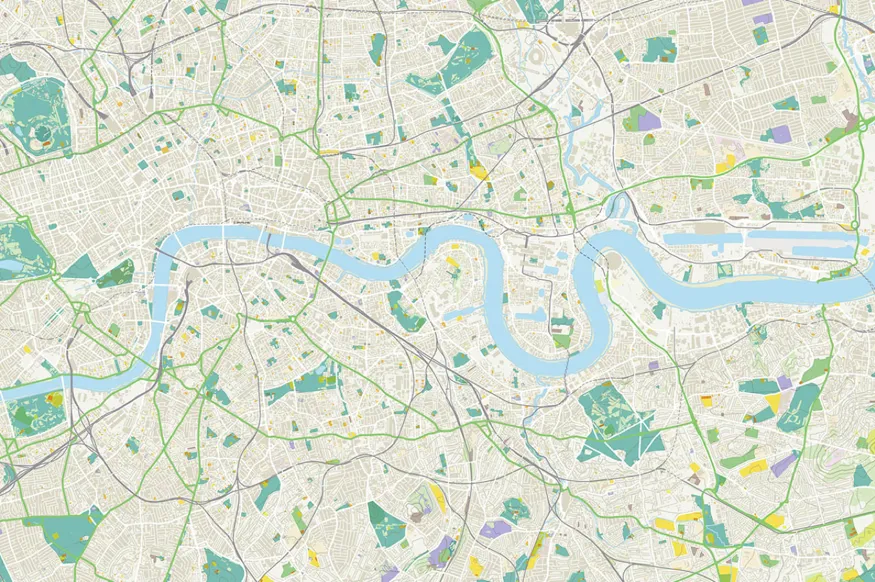
Vector tiles are exactly that: clipped tiles, or grid squares, composed of layers of vector features. They are served in a similar way to raster tiles. A client application requests tiles based on a zoom level and extent, and the server responds with binary data representing the vector tiles containing the layers to be visualised on that map.
Rendering is done in the client. As personal computers and mobile phones have become more powerful, vector tiles are an increasingly attractive way to create interactive web maps. But why?
The benefits of vector tiles
Vector tiles offer a number of advantages over raster map tiles for web mappers.
Firstly, they can be customised extensively by the user. Styles can be customised and adapted as a default or based on user interaction – for example, to highlight a particular layer or feature. Because they are rendered in the client, custom styles can be defined and applied when the map is created. Designers can adapt the style of their maps so they match organisational colour schemes (visit Maputnik for a great tool to create vector tile styles).
Secondly, maps made with vector tiles are fast. A vector tile service will send much less data than a raster service would send for the same map, meaning lower bandwidth use and lower disk space requirements. Features are represented in a very lightweight manner and styles are only defined once before being applied to a layer no matter how many features. This makes vector tile maps great for mobile and low-bandwidth uses.
Vector tile maps have a much smoother zooming effect than raster maps. Because raster data is represented as pixels, maps can get grainy as a user zooms in, until a higher-resolution tile is received from the server. Vector tiles instead maintain a smooth zooming and scaling effect.
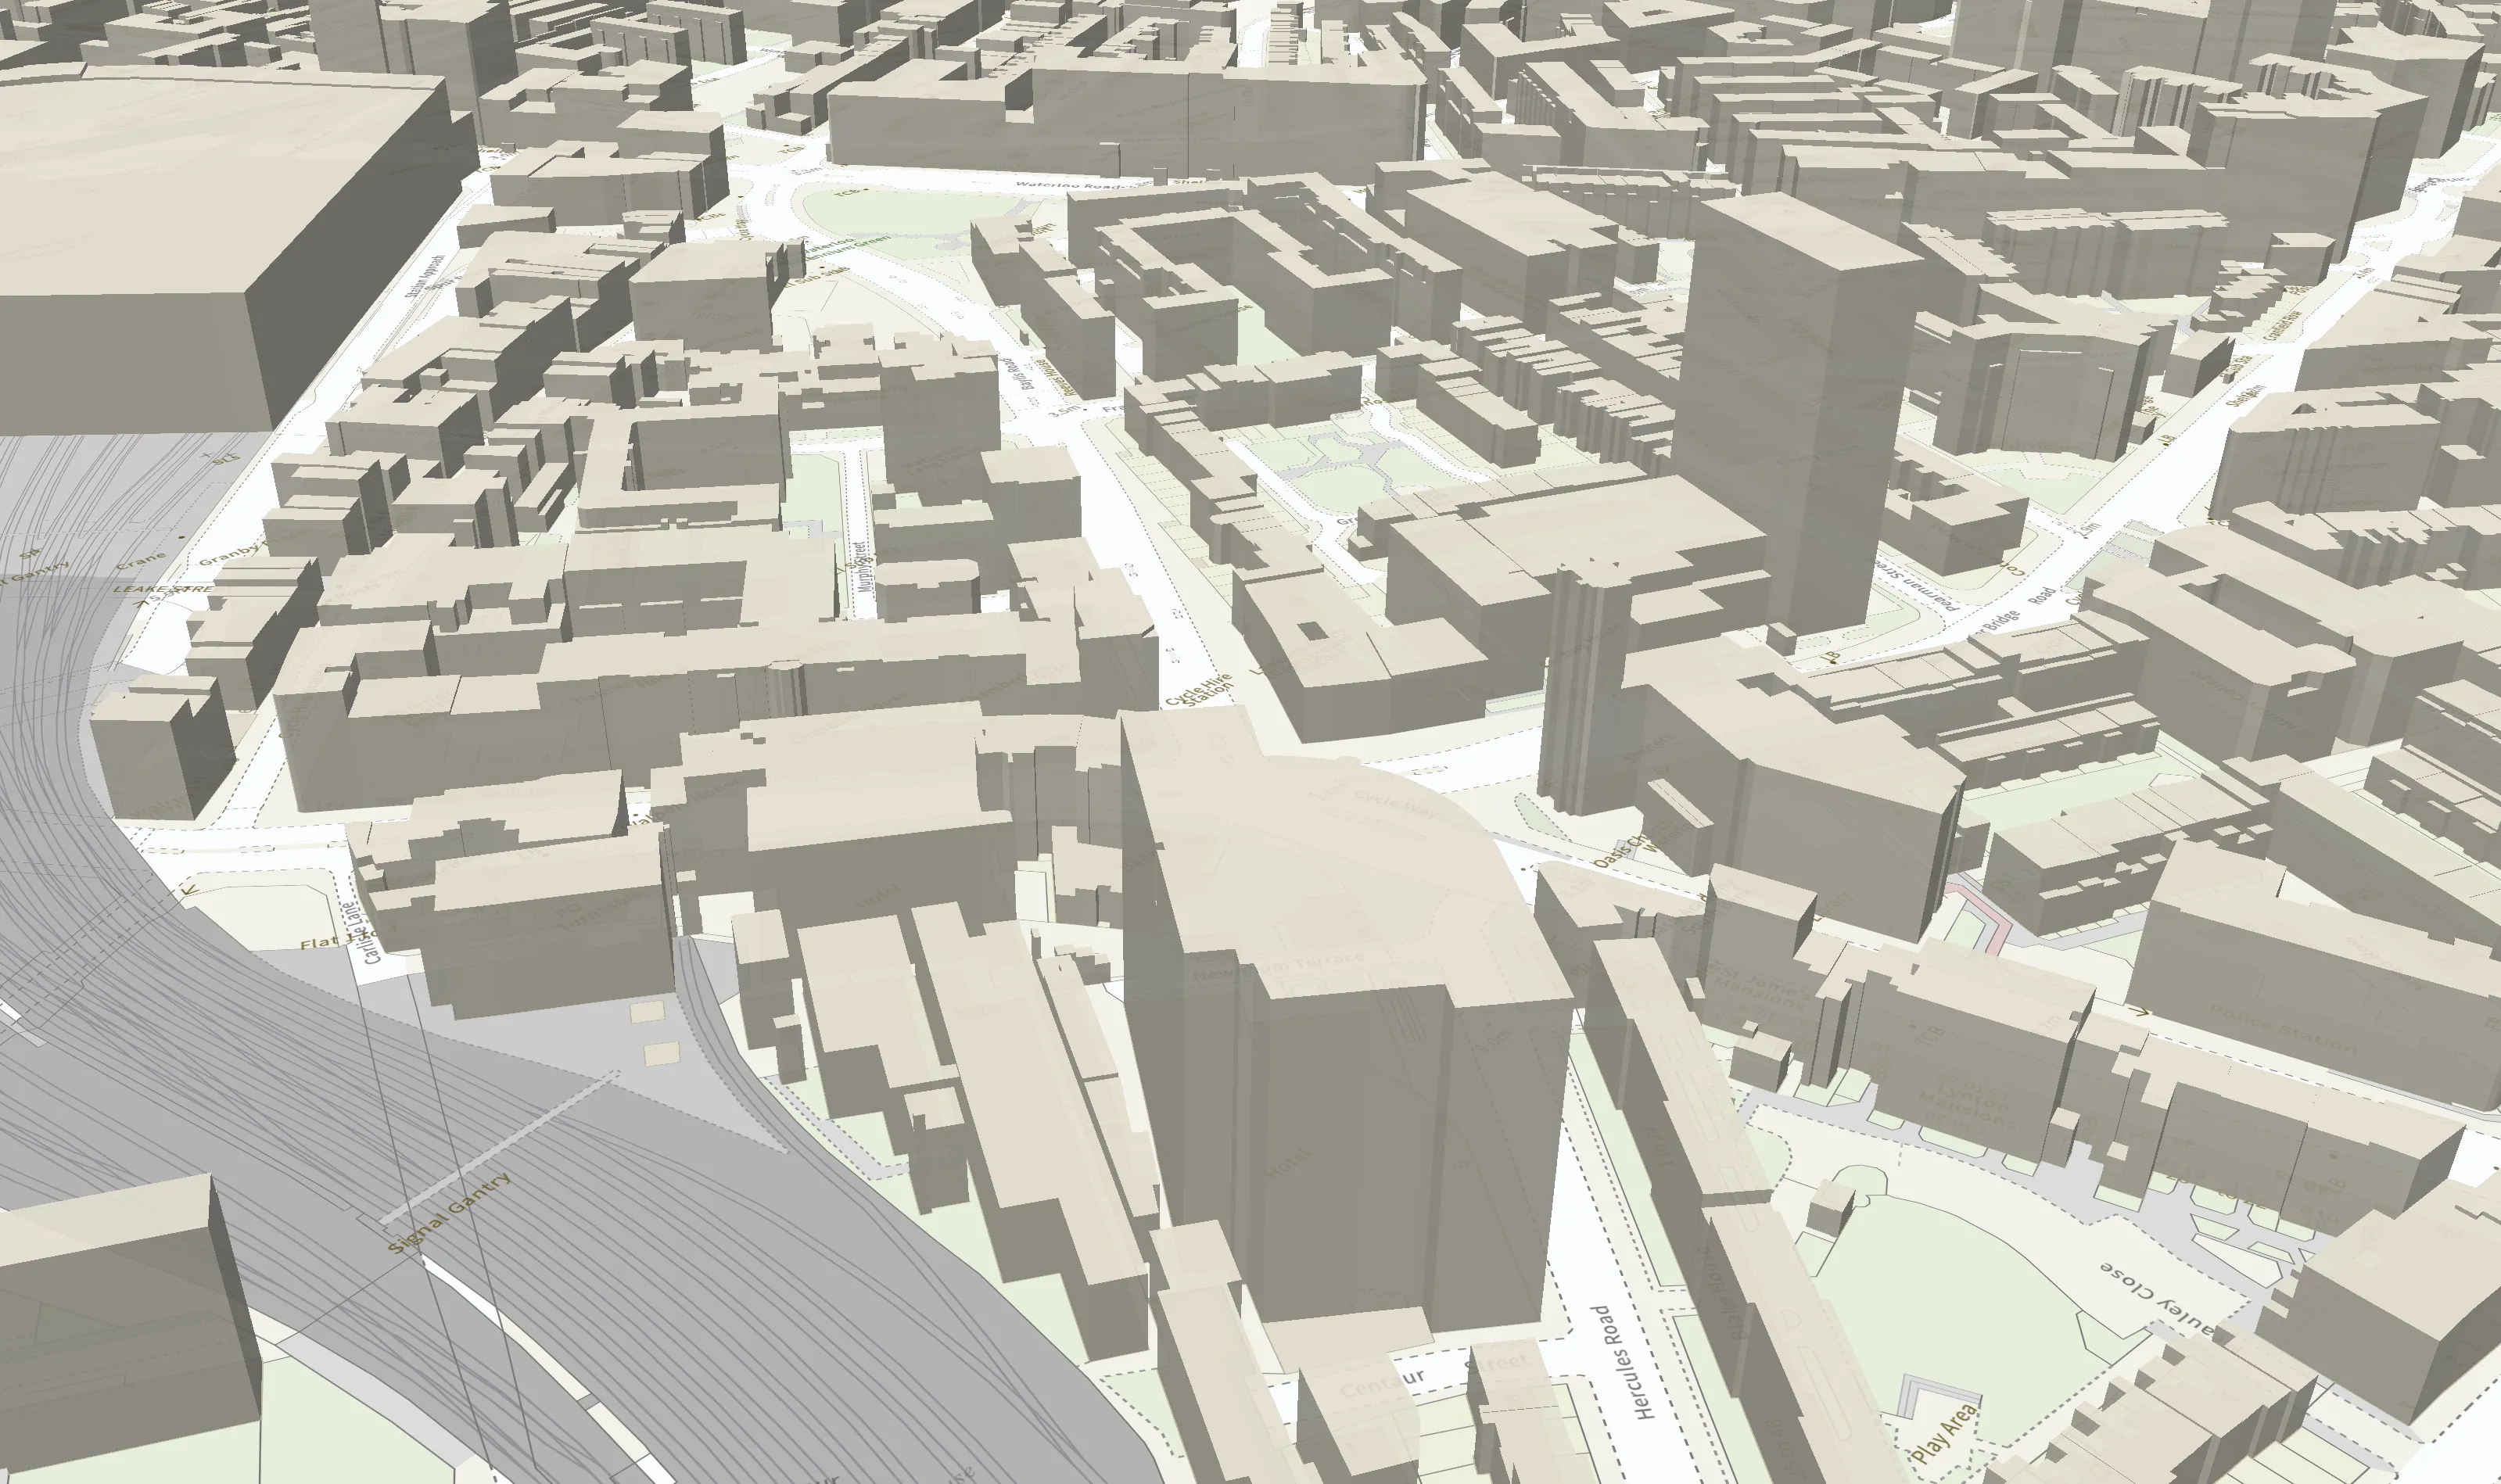
Another advantage of vector tiles (which include labels as vector features) is that rotation, tilting and other 3D effects are possible. Buildings can be extruded to create 3D cities and camera pitch can be adjusted to give the effect of looking across land, rather than only straight down on it.
Vector tile maps are well supported and can be developed with common mapping libraries including Leaflet.js, Mapbox GL JS, and the ArcGIS API for JavaScript.
Additionally, vector features are often served with some attribution. This means that features include some metadata, which are properties that describe or identify the feature. Many vector tile services include minimal attribution data to make sure maps load quickly and, even with minimal attribution, map developers can apply styles and interactivity to vector features that are not possible with raster maps.
Vector tiles from OS
With all these advantages, vector tile maps are a must-know for any web map developer. Based on user feedback, in early 2019 OS launched a Vector Tile Service based on our OS Open Zoomstack dataset. This year we’ve launched a new and improved OS Vector Tile API, which includes our flagship premium OS MasterMap Topography Layer data.
Access the OS Vector Tile API via the OS Data Hub and start creating these fast and versatile maps of Great Britain. All you need is an API key!
What is the OS Data Hub?
Launched on 1 July, the OS Data Hub is the new way to access our authoritative location data. It’s replaced the current OS ordering systems (OpenData Portal, OS Orders and API shop) with one mobile-friendly platform with a single sign on to give you a better user experience.
OS for developers
Whether you’re new to geospatial or a GIS data expert, our data platform grants access to our data

Our highly accurate geospatial data and printed maps help individuals, governments and companies to understand the world, both in Britain and overseas.
Find more blog articles
- Developers