Celebrating The Cairngorms National Park’s 20th Anniversary
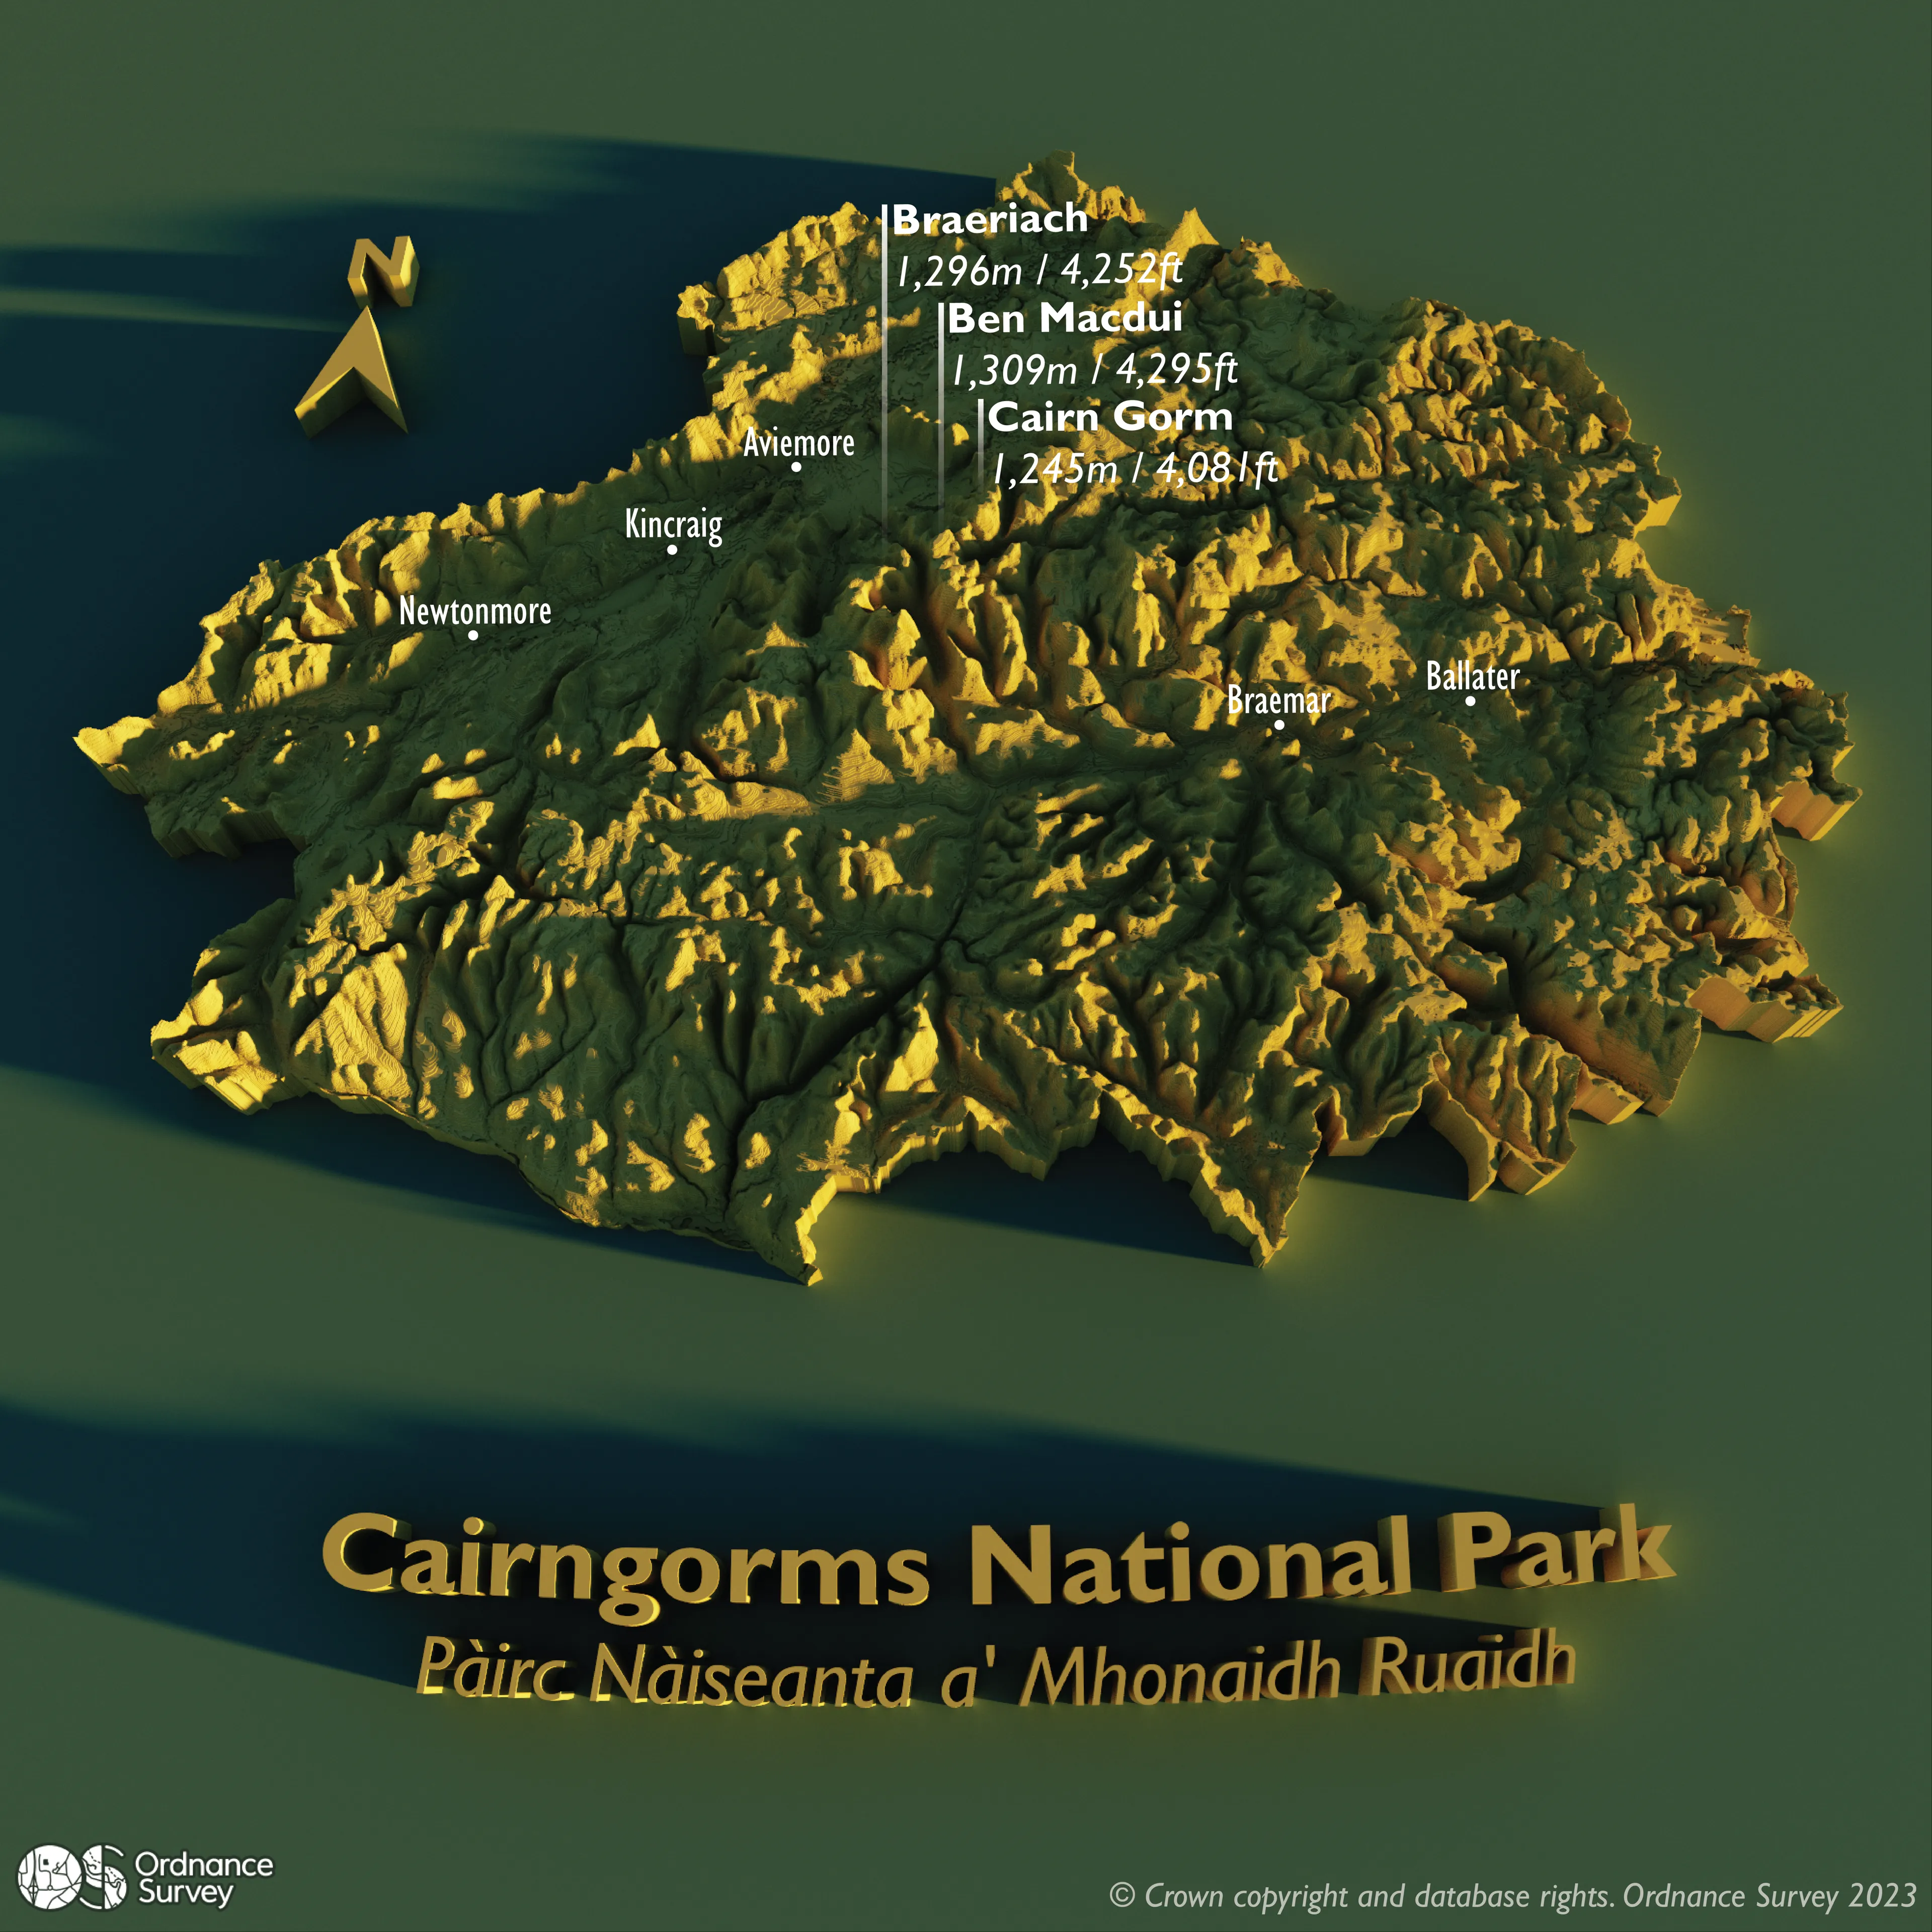
Nestled in the heart of the Scottish Highlands, the Cairngorms National Park stands as a testament to the raw beauty of nature. For many decades, it has been a sanctuary for both wilderness enthusiasts and admirers of the amazing landscapes it encompasses. As we commemorate the 20th anniversary of it officially being designated a national park, we find ourselves captivated by the park's unique character – its high plateaus, rugged summits, and dramatic cliffs.
In honour of this milestone, we wanted to create a visual that celebrates the dramatic landscape but also pays testament to the technology that has enabled us to capture the detail of the terrain in high resolution. In this comprehensive how-to guide, we take you through the intricacies of data acquisition, processing, 3D modelling, and visualization.
How to create a 3D visualisation of the Cairngorms National Park
Step 1 – Data Selection
The first step in any data visualisation is data selection. We wanted our visual to capture the defining characteristics of the Cairngorms – its expansive high plateau adorned with numerous summits, interspersed by dramatic cliffs. To present this distinctive landscape in its most captivating form, we need a relatively high-resolution dataset. We selected OS Terrain 5, a digital elevation model (DEM) of Great Britain with a 5-meter resolution. OS Terrain 50 (OS Open Data) is a great alternative for those looking to recreate this data visualisation using OS Open Data and the resolution is more than good enough for this task.
The easiest way to get a DEM of just your area of interest (in this case, the Cairngorms National Park) is to bring the raster DEM data (.asc, .tif, .geotif, or equivalent raster file type) into a GIS such as ArcGIS Pro or QGIS. You can also create a DEM directly from spot height or contour vector data in shapefile or geopackage format which we explain in more detail later.
We used the OS Terrain 5 ASCII grid files (equivalent to the OS Terrain 50 ASCII grid data available to download for free from the OS Data Hub).
Step 2 – Data Import and Clipping to Area of Interest in a GIS
Option 1: Using a DEM dataset
If you’re using a raster dataset, import this data into your chosen GIS. If you’re using OS Terrain 5 or OS Terrain 50, the data will likely be split into tiles so you may want to just load the tiles for your broad area of interest as loading and processing a national coverage may take a long time. Once loaded you’ll need to merge the individual raster layers into a single raster using a Merge tool in your GIS.
Next, clip the DEM to your area of interest. To create the area of interest we loaded the ‘national_park’ layer from OS Open Zoomstack into our GIS, selected the Cairngorms National Park polygon and exported it to a new layer. We then used the ‘clip’ tool to clip the DEM to the boundary of the national park.
We exported the resulting DEM as a .tiff file.
Option 2: Creating your own DEM from Contour or Spot Height data
If you only have access to contour data, it is possible to create a DEM by interpolating a surface between the contours using the geoprocessing tools in your GIS. Contour data is available in Ordnance Survey’s Terrain 5, Terrain 50 and Open Zoomstack products. The quality of the output DEM will depend on the resolution of the input data, so it’s worth being aware of this.
Before creating your DEM, clip your vector data to your area of interest. To create the area of interest for the Cairngorms National Park, load the ‘national_park’ layer from OS Open Zoomstack into your GIS, select the Cairngorms National Park polygon and exported it to a new layer. Then, use the ‘clip’ tool to clip your input data to the boundary of the national park.
In ArcGIS Pro, a DEM can be created by using the Topo to Raster tool, whilst in QGIS you can achieve the same thing using the GRASS plugin. You’ll be able to select the cell-size you want the output DEM to have – although be wary of the resolution of your input data.
It is also possible to create a DEM from spot height however it is likely that the output will appear overly smoothed and may not give enough topographic detail to showcase the dramatic cliffs and mountain tops of a rugged terrain.
Export the resulting DEM as a .tiff file (or equivalent raster file format).
Step 3 – 3D rendering of the landscape in Aerialod
To create the 3D visualisation, we used a open-source piece of software called Aerialod, which can be downloaded for free. Aerialod is an interactive path tracing renderer designed for heightmaps and is a great way to visualise terrain but also population and other aspects which vary spatially.
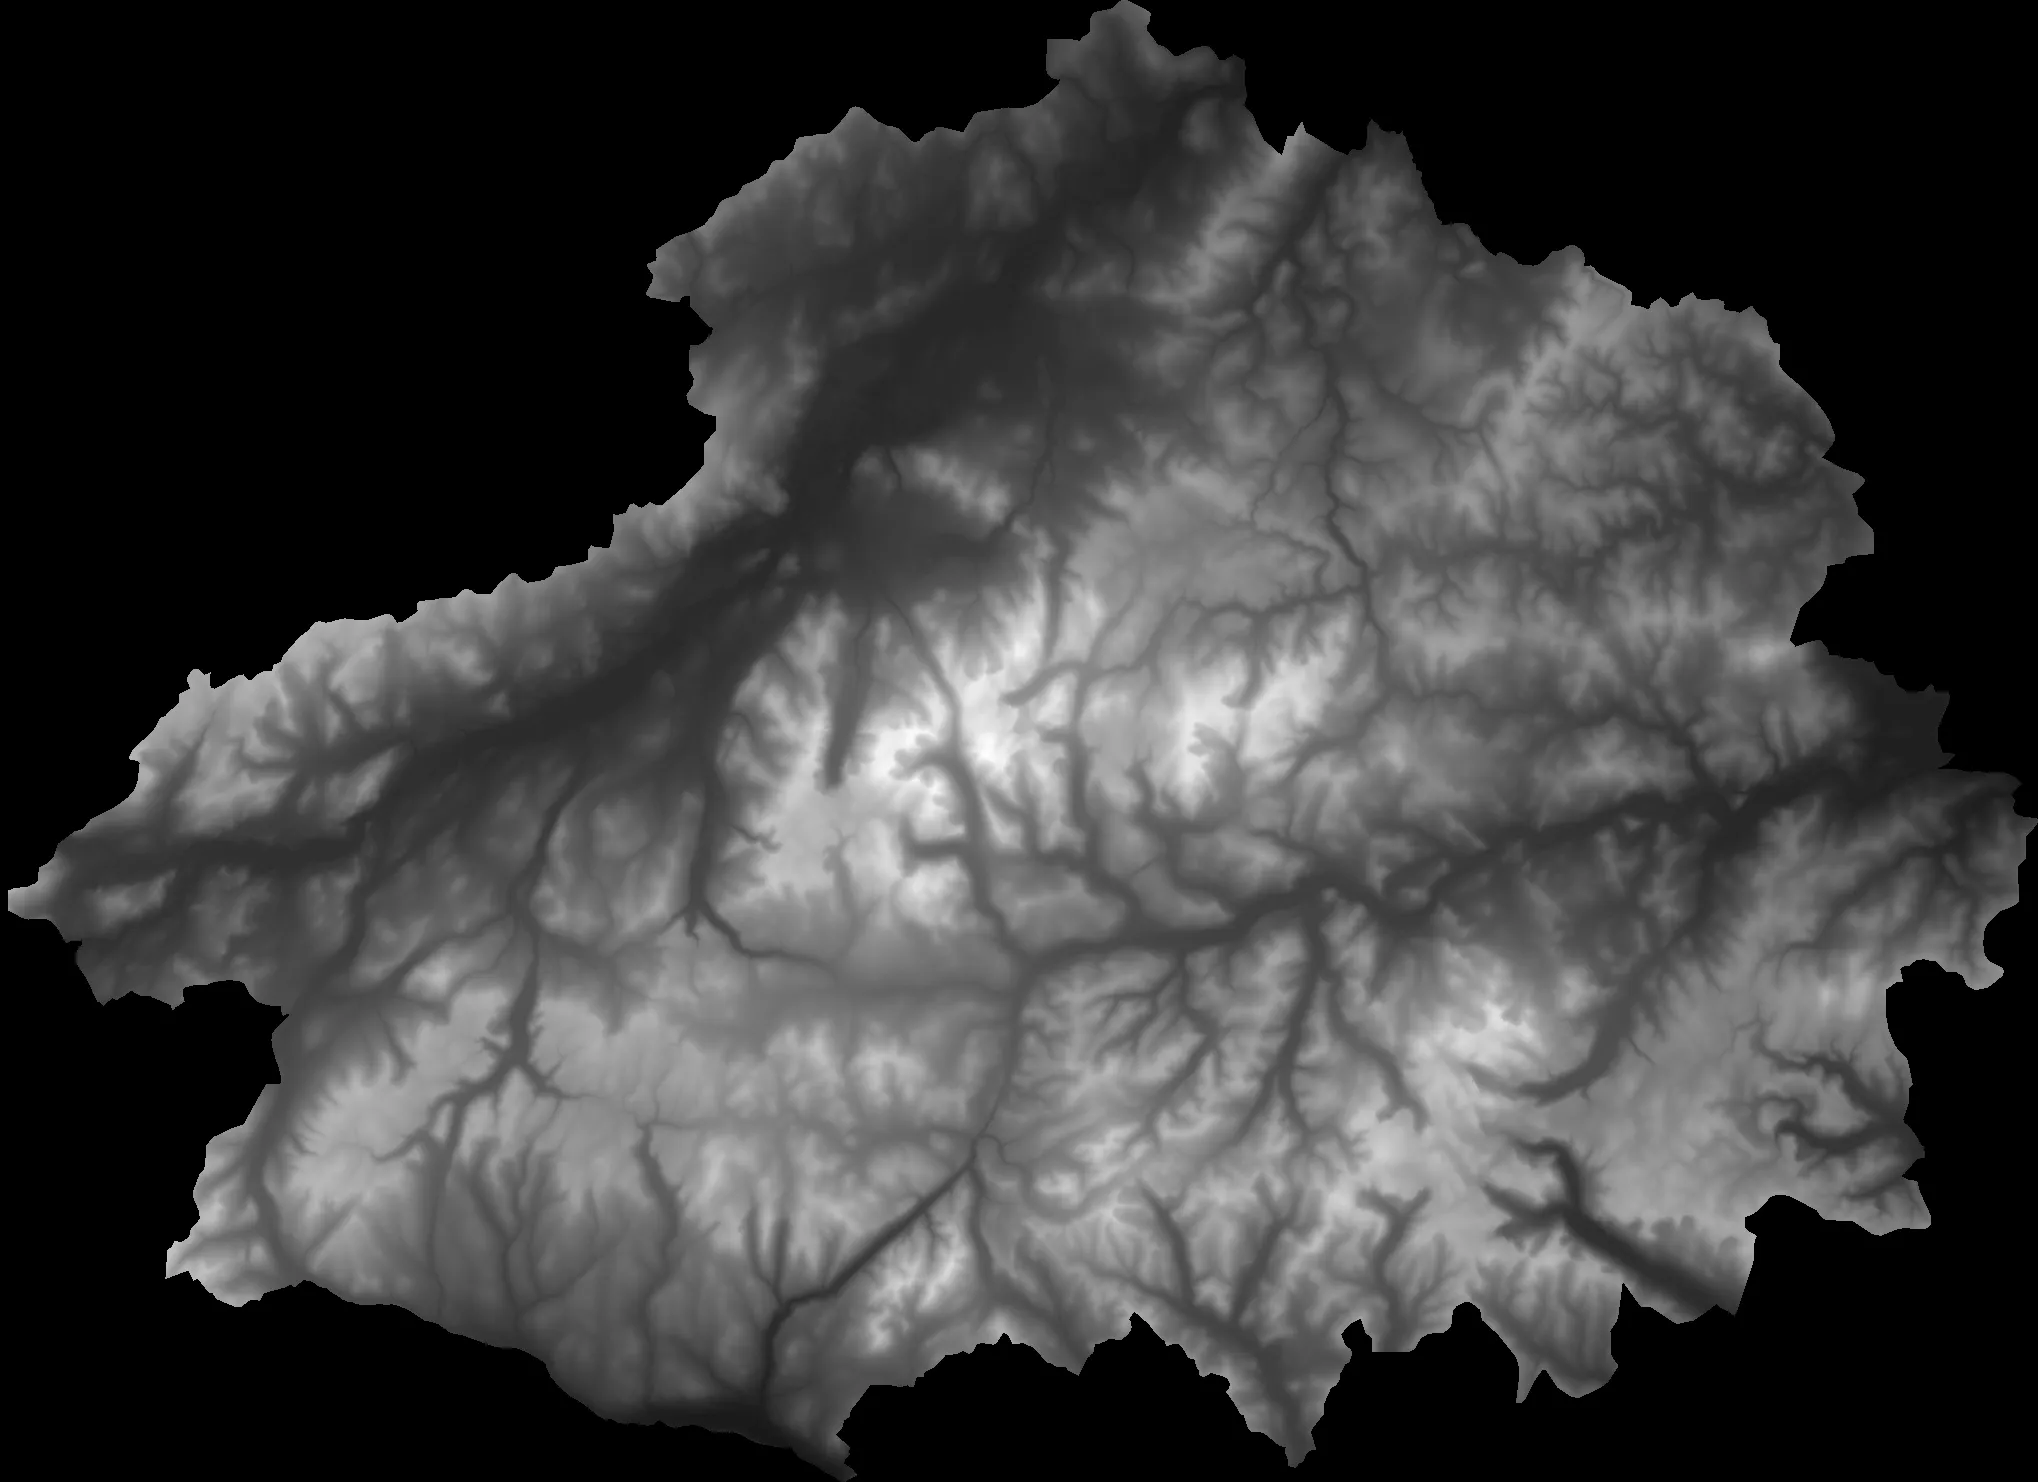
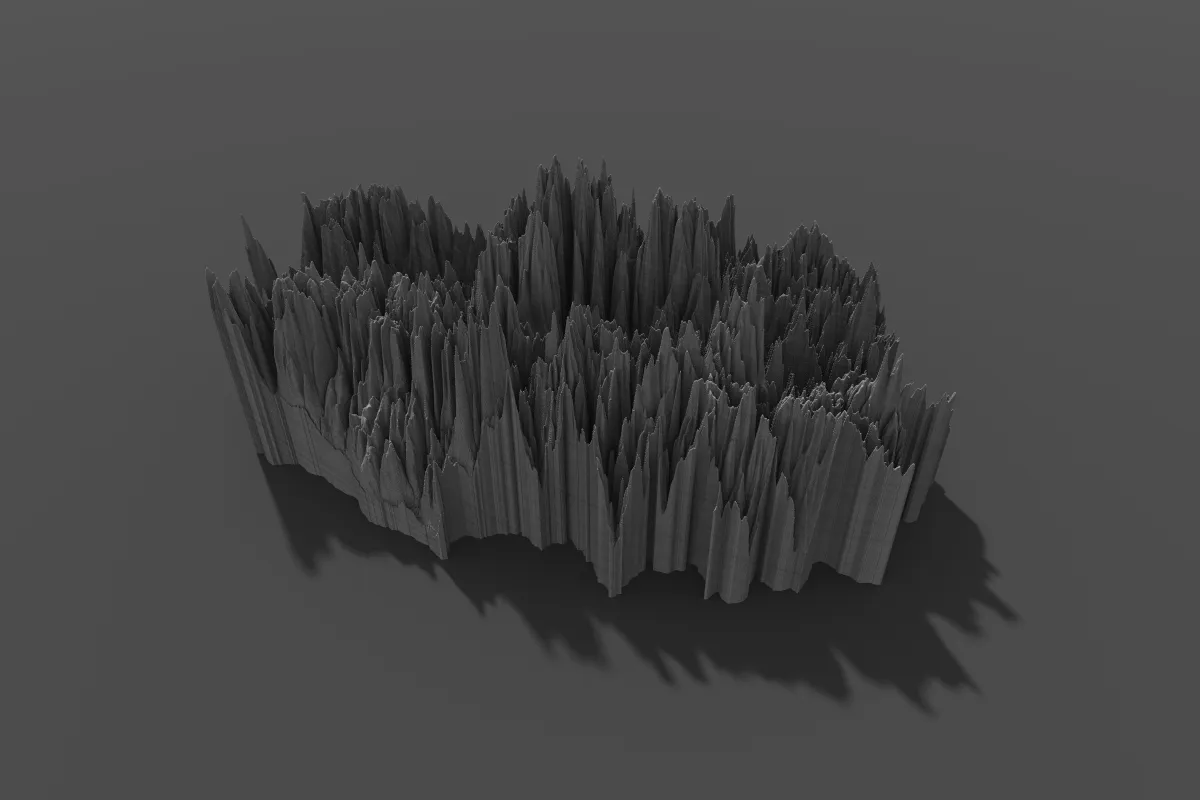
Open your .tiff file in Aerialod (folder symbol in the top right). Your data should now appear in the main window as a 3D model. It may initially appear pixelated – bear with it, it may just take a while to render.
Aerialod translates the image into a 3D model using pixel lightness—light pixels transform into peaks, and dark pixels into troughs.

If you want to include text within your final image with the same 3D look and feel (as we have), before you import your DEM into Aerialod, open up the file in a vector editing software such as Adobe Illustrator or Inkscape and add your text. As we noted above, the colour of the pixels determines its ‘elevation’ in Aerialod. We therefore recommend you pick a colour of text that is lighter than the background. The same technique can be used for the north arrow. When you’re happy, re-import your new image into Aerialod to continue refining the design.
Within Aerialod, orientate the scene such that the north arrow points upwards. You can do this by right clicking on your map and moving it to the desired view. You can zoom in and out using ‘w’ and ‘s’ on your keyboard.
Beware: a left mouse click alters the focus point – focusing on the point you clicked on. If you want to reset this and return to everything in focus – under ‘Lens’ on the panel on the right, put the focus back to 0.
Next, change the frame aspect ratio to match the aspect you want the final image to be exported at e.g. 2000 x 2000 (toolbar top right of the Aerialod). We also changed the view from an Orthographic (Orth) to a Perspective (Pers) view in the toolbar at the bottom.
In the Map panel on the right, click ‘All’ to show all the available settings. Have a play with the ‘scale’ setting which will determines how exaggerated the terrain is.

The sun and sky settings were adjusted by lowering the position of the sun in the sky and adjusting its angle to simulate a morning sunrise effect (10, 60), with light casting an east-to-west perspective. The Area for the sun was set to 60 and Intensity to 70. Additionally, within the ‘Sky’ settings, the mode was set to ‘Atmospheric Scattering’, the Rayleigh changed to 60 and Mie to 0 – this mimics light falling on a surface under atmospheric conditions. Under the Bounce setting, diffuse was set to 10 and energy to 5, changing the way light bounces off surfaces.
In the right-hand panel under ‘Film’, the exposure was increased to 10 to lighten the scene. The next step was to alter the colours to bring the landscape to life. In the left-hand panel the ‘Ground’ colour was changed to HEX 152643 (a dark blue) and then in the right-hand panel ‘Color’ was changed to HEX 82653d (a mid brown). Finally, we changed the rendering option from cube to poly, resulting in a smoother surface.
Feel free to have a play with the various settings – you can create some amazing (and very realistic) scenes just from a simple DEM.
Step 4 – Adding labels in Adobe Illustrator
The final image was imported into the vector graphics editing software, Adobe Illustrator. Open-source vector editing software such as Inkscape or GIMP could also have been used.
Labels were then added for notable mountains such as Ben Macdui, Cairn Gorm, and Braeriach, accompanied by their respective heights. We also included a few towns to help viewers orient themselves within the landscape.
Benefits of the OS Data Hub
Whether you’re new to geospatial or a GIS data expert, the OS Data Hub grants access to our data. Discover our platform and the benefits of using it, along with an explanation of the types of GIS data you can get.

Our highly accurate geospatial data and printed maps help individuals, governments and companies to understand the world, both in Britain and overseas.
Find more blog articles
- Reference
- Developers
- Government and public sector
- Great Britain
- United Kingdom