Data visualisation
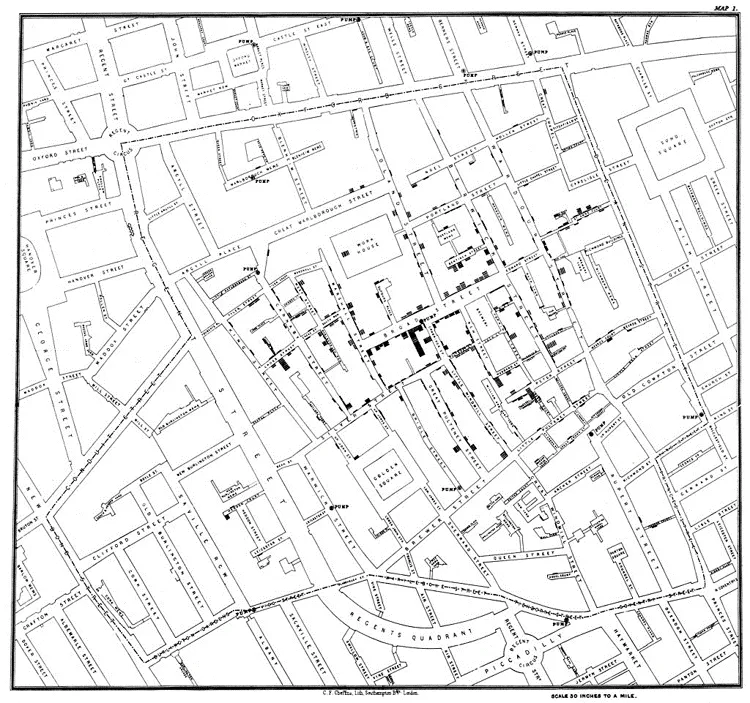
John Snow was an English physician and a sceptic of the miasma theory. By visually representing the location of each cholera case on a map, Snow was able to show evidence of a connection between the Broad Street water pump and the number of cholera cases in the immediate vicinity.

This map presented the data visually and geographically, allowing us to see a pattern and correlation between the water pump and location of cases. Not only did this insight ultimately lead to the discovery of the source of the outbreak, it forever changed how we interpret our world.
What is data visualisation?
"The purpose of visualisation is insight, not pictures."
Good question! Data visualisation is the representation of information or data in a visual format. This can take many forms and includes maps, charts, graphs and animations. Data visualisation is chosen as a form of communication because the human brain finds it easier to process complex data in the form of a well-designed visual (as opposed to large spreadsheets or detailed reports).

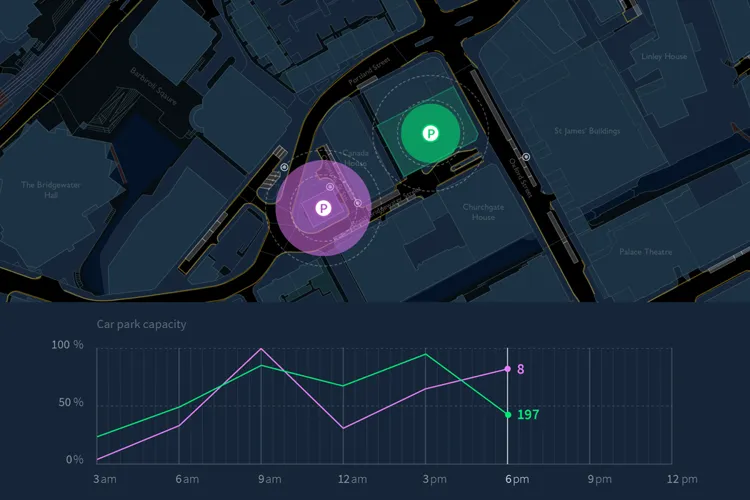
In today’s world, many services, applications and businesses rely on geographic data. Being able to visualise location-based datasets is paramount to deriving faster insights and drawing data-driven conclusions.
Data visualisation is probably more important now than ever before. From reporting on Covid-19 to the US Presidential race, we are exposed to a range of charts, maps and graphs on a daily basis. As a result, it is imperative that these visuals are clear, concise, well-designed and easy to interpret.
Data visualisation mini-series
As part of our Developer blog series, we’re going to run a mini-series over the coming months. This will explore some of the many different visualisation possibilities that OS data can offer. In particular, we will include further insight on how the new APIs can be used in this way. These APIs are accessible via the OS Data Hub.
To ensure we focus on the areas that our users and community are most interested in, we would like your help. From the list below, please comment on this blog your top 3 areas of interest around geospatial data visualisation. Using the same list, we will also be running a Twitter poll from today.
- Dashboards (used to view geographic information and data)
- Thematic Maps (used to map particular themes to geographic areas)
- Flow Maps (used to visualise origin-destination flow data)
- Story Maps (used to follow a narrative)
We want to produce content to help you with the creation of a visual or a map, so we are keen to know what you would like to see in our data visualisation mini-series. Thank you in advance for your feedback.
Alongside the tools we use here at OS, there are many others worth shouting about that we thought we’d share. Please note this list is not exhaustive and there are many more out there to experiment with and explore.
- QGIS – a free and open source geographic information system for exploring and analysing spatial data and creating maps
- ESRI ArcGIS – a platform for creating, managing, sharing and analysing spatial data
- Cadcorp – desktop geographic information system and mapping software for sharing spatial data
- MapInfo – desktop geographic information system for exploring spatial data and creating maps
- Mapbox – an open-source mapping platform for making custom designed maps
- Kepler – an open-source geospatial analysis tool for large-scale data sets
- Tableau – a visual analytics platform
- Power BI – a collection of software services, apps and connectors that turn data into visuals
- Leaflet – an open-source JavaScript library for web and mobile-friendly interactive maps
- D3.js – a JavaScript library for manipulating documents based on data
- R – a free software environment for statistical computing and graphics
- Maputnik – an open-source visual editor for the Mapbox style specification
- Datawrapper – an editor that lets create and publish responsive charts, maps and tables for free
- Adobe Illustrator – a vector graphics editor and design program
- Geojson.io – a simple tool for creating, changing and publishing maps
- Mapshaper – an in-browser tool for working with spatial data
- Carto – a location intelligence platform providing GIS, web mapping and data science tools
OS for developers
Whether you’re new to geospatial or a GIS data expert, our data platform grants access to our data

Our highly accurate geospatial data and printed maps help individuals, governments and companies to understand the world, both in Britain and overseas.