30 Day Map Challenge
OS cartographers created 30 maps in 30 days for month-long challenge
At OS, we get involved by inviting our colleagues to pick a day and make a map on the specified theme. This results in a wonderful creative mix of different types of maps, all created with different techniques and datasets.
Have a scroll through to see the maps made by OS staff for 2022’s challenge. Alternatively, you can wander around our 30 Day Map Challenge virtual exhibition space made by Product Development Consultant Guy Heathcote.
Day 1 – Points
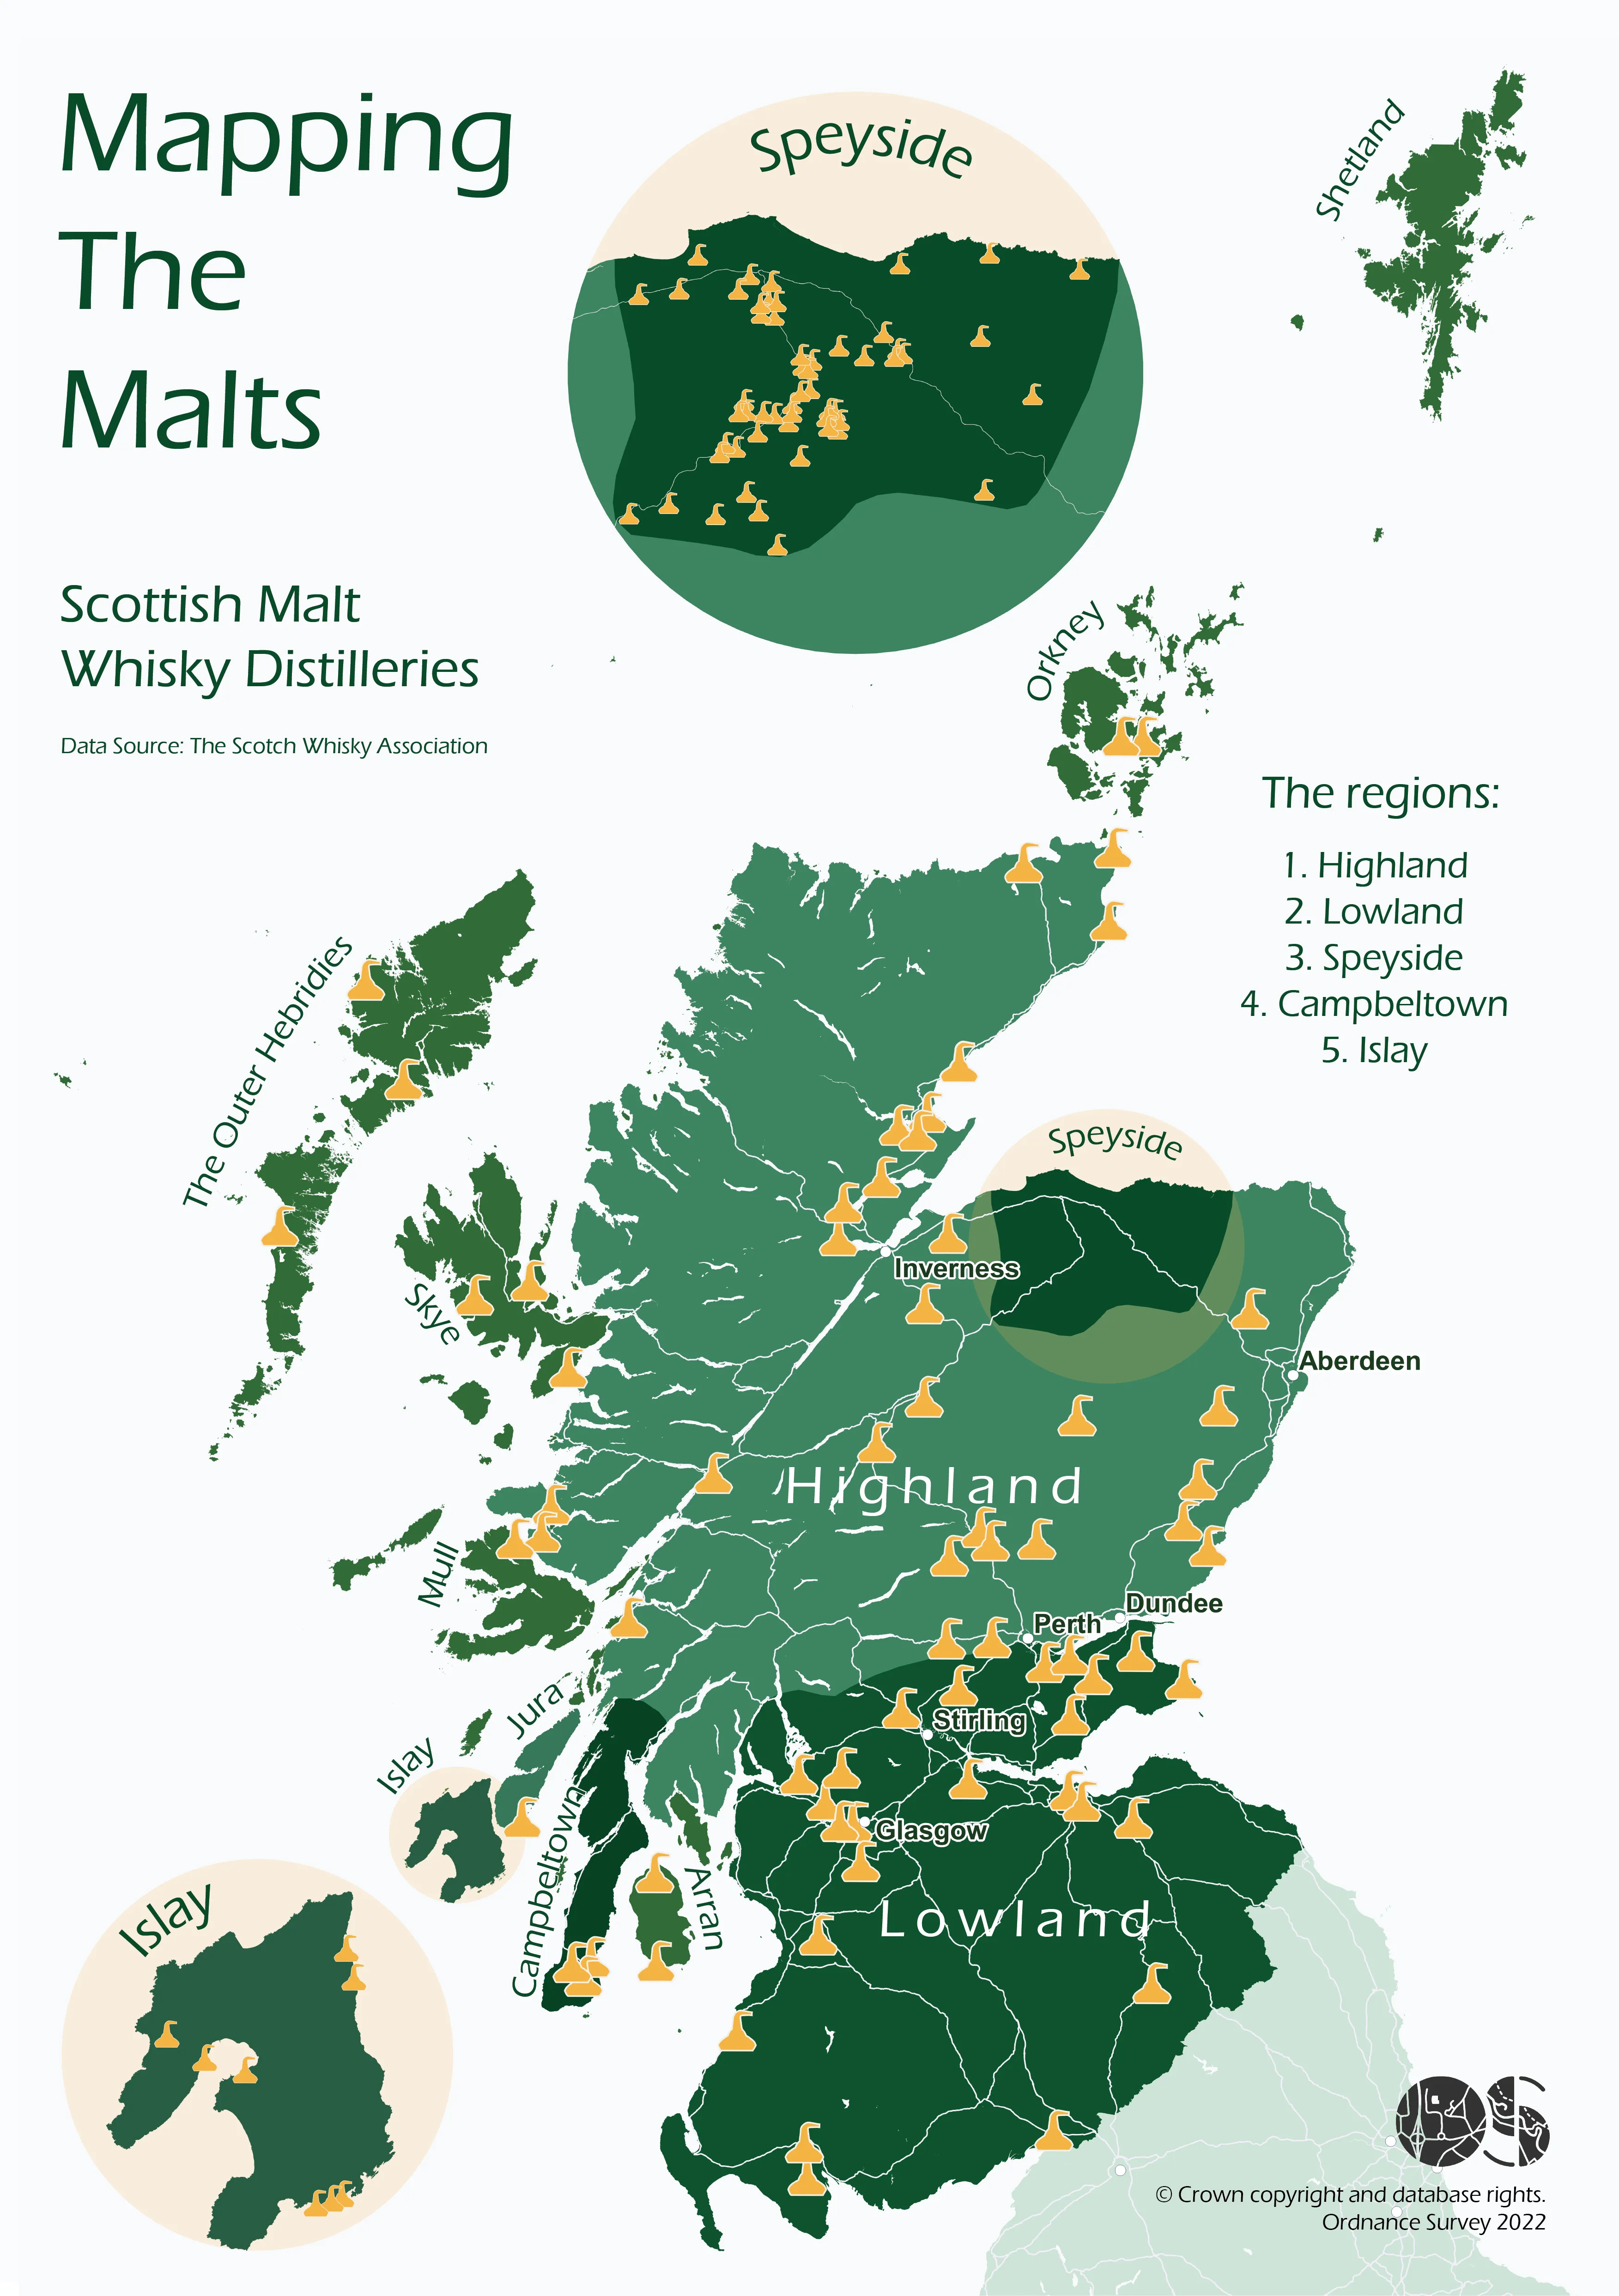
Mapping the Malts, Hannah Wright
Scotland has over 130 malt whisky distilleries, producing more Whisky than anywhere else in the world. Scotch Whisky is made from just 3 ingredients: water, yeast and cereals. To be a Scotch, the Whisky must be made, distilled and matured in Scotland and must be matured for a minimum of 3 years in oak casks. There are 5 main Whisky regions: Highland, Lowland, Speyside, Islay and Campbeltown.
Day 2 – Lines
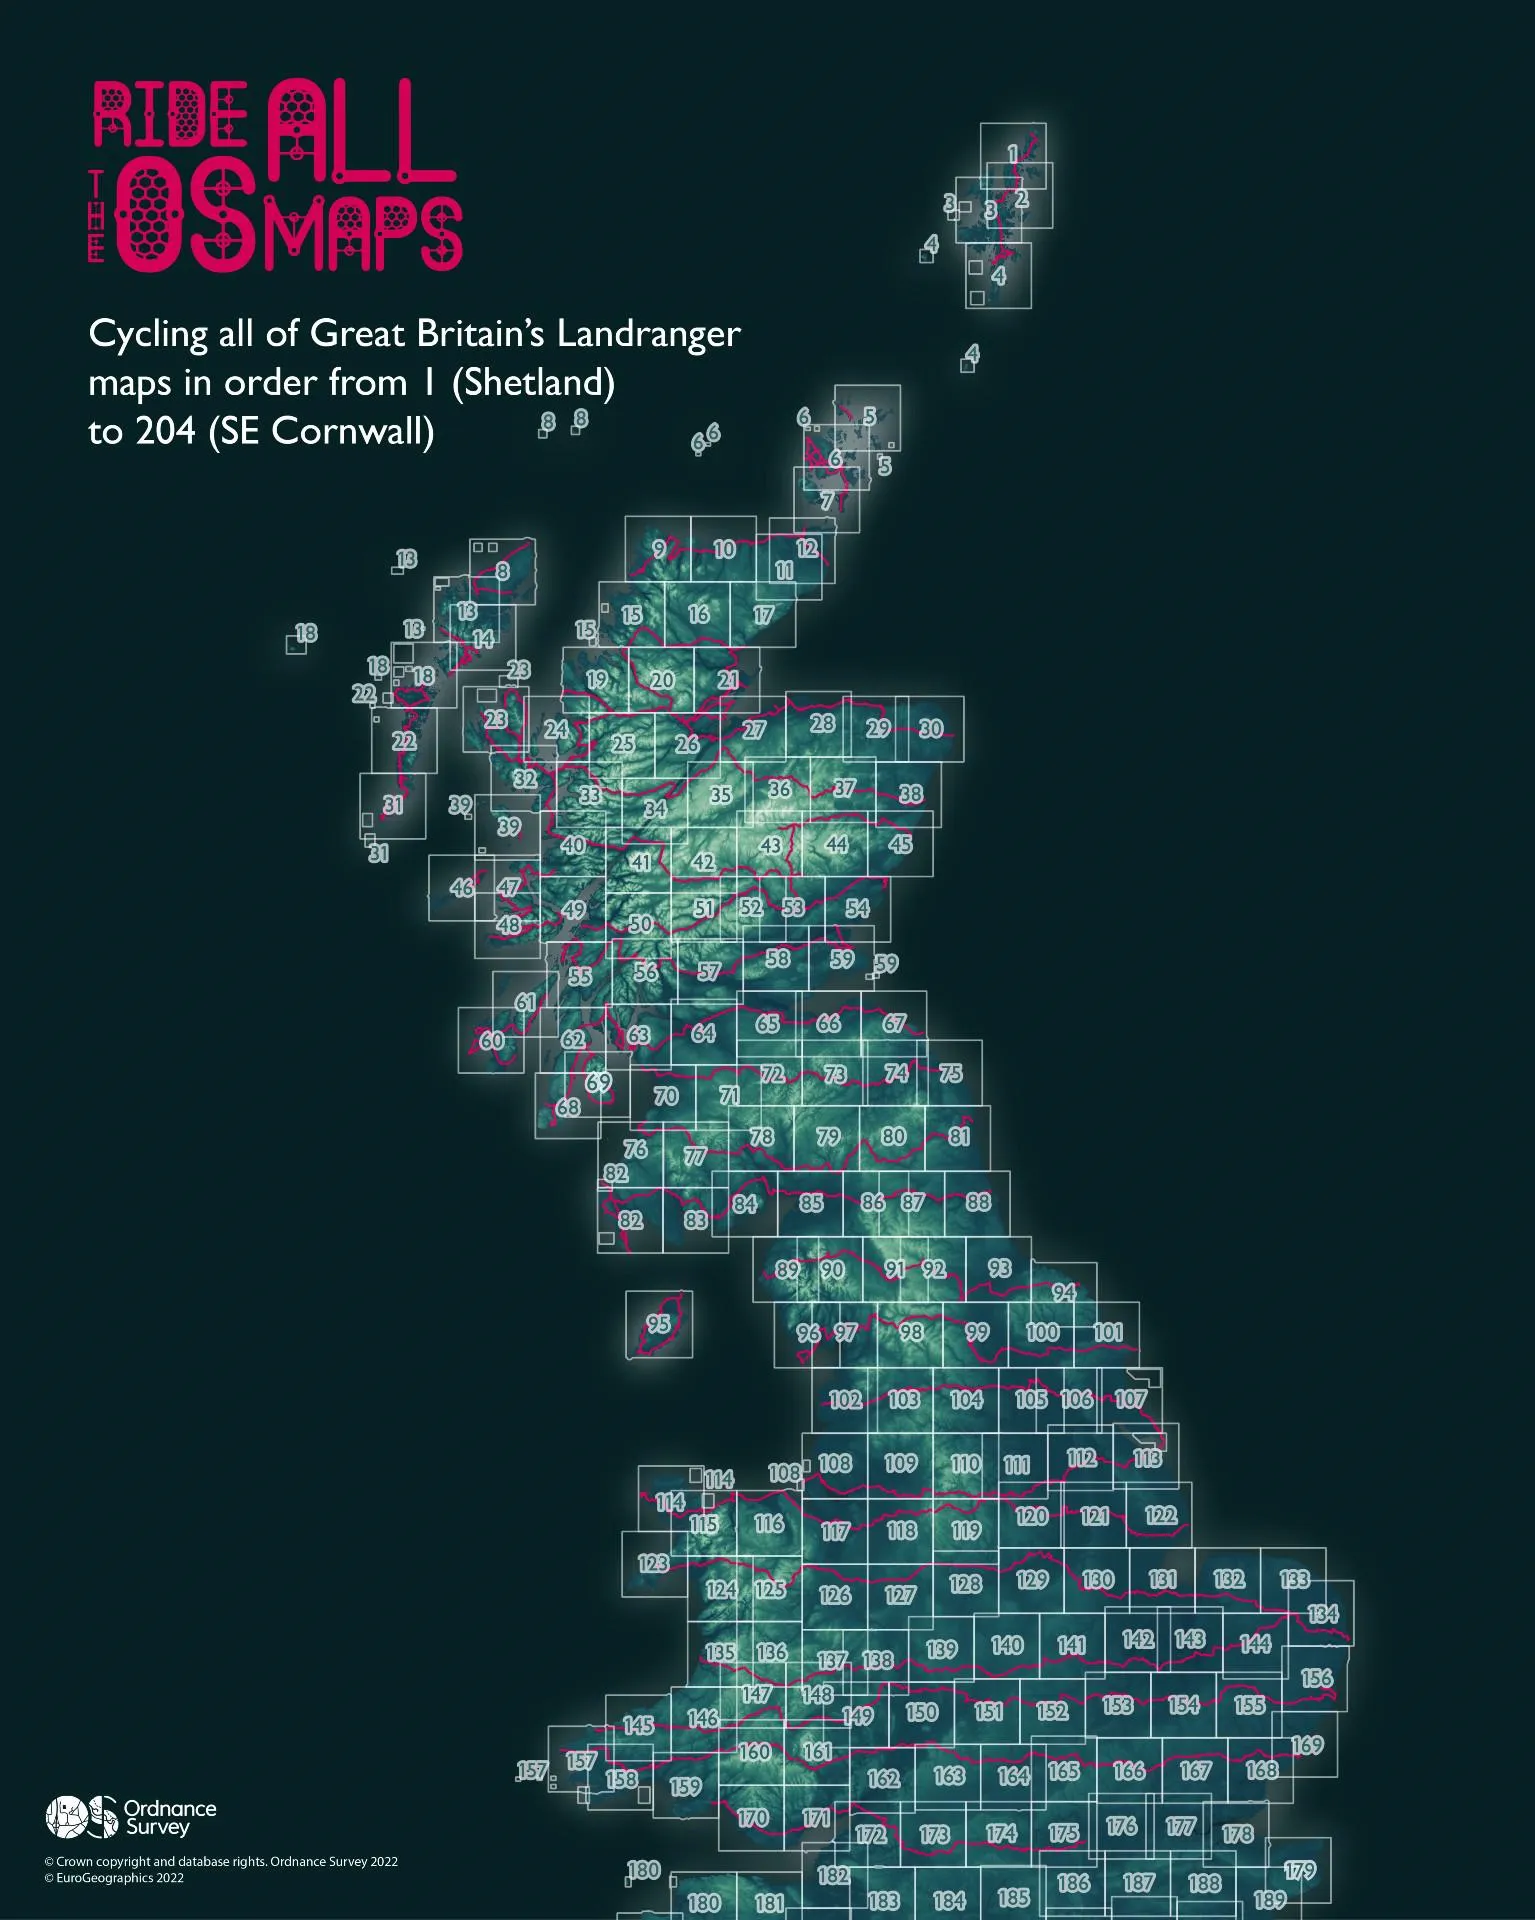
Ride All the OS Maps, Jessica Baker
Mark Wedgewood has been undertaking the mammoth challenge of cycling across all 204 OS Landranger maps, in consecutive order. He started at number 1 in the Shetland Isles, and as of late October 2022 has reached number 175 near London. We’ve been mapping his progress over the last few months and wish him well for the final few coast to coast journeys!
At time of creation, Mark was still underway on his adventure. He has now finished and you can read all about it here: https://ridealltheosmaps.co.uk/
OS Data used – OS Terrain 50, OS Open Zoomstack, OS Landranger map extents
Day 3 – Polygons
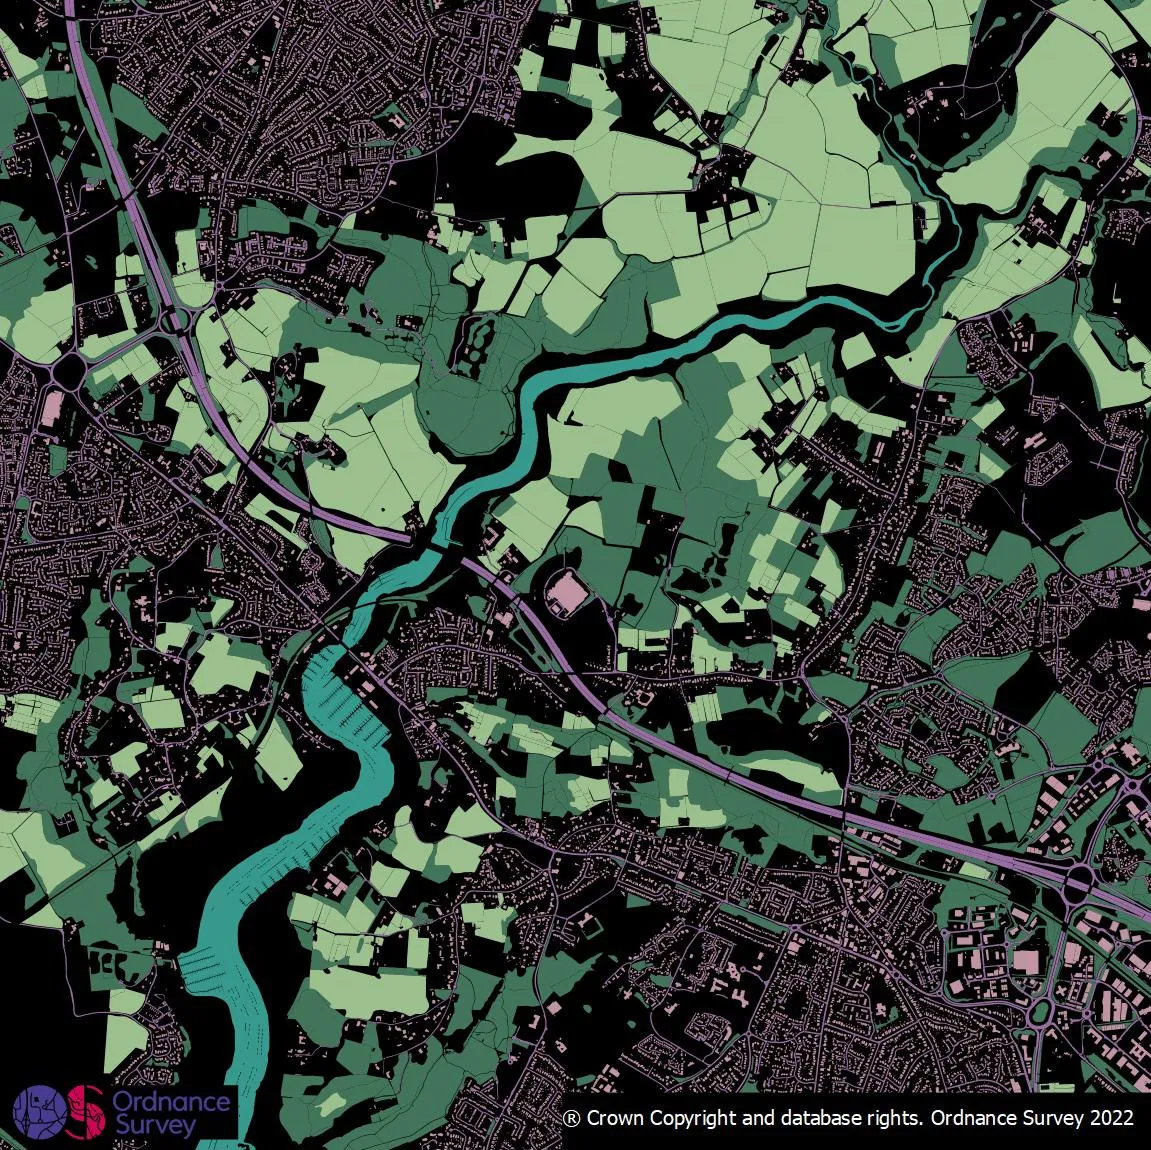
The Natural vs Manmade world, Freya Cooper
This map shows the balance of the natural world and the manmade world around OS HQ using polygons from OS MasterMap Topography.
The types of polygons were pulled out of the description type within the attribution, and I searched for descriptions such as 'natural fill', 'manmade fill', 'building fill' and 'water fill'.
OS Data used – OS MasterMap Topography Layer

Day 4 – Colour Friday: Green
Fritham, Guy Heathcote
This entry takes the brief very literally - and features a lot of green! It’s a representation of the Fritham area of the New Forest, near to the A31 and looking across towards Southampton. The image was created in Blender, using its ‘geometry nodes’ functionality to convert 2D land area polygons and ‘obstruction’ line features into scattered collections of 3D vegetation icons and fence objects respectively. These were then combined with nadir imagery and Terrain50 to create the final scene. There’s no hidden meaning here…it just seemed to be an unusual way of using conventional Ordnance Survey topographic features.
OS Data used – OS MasterMap Imagery Layer, OS Terrain 50, OS Select+Build Landform Point
Day 5 – Ukraine
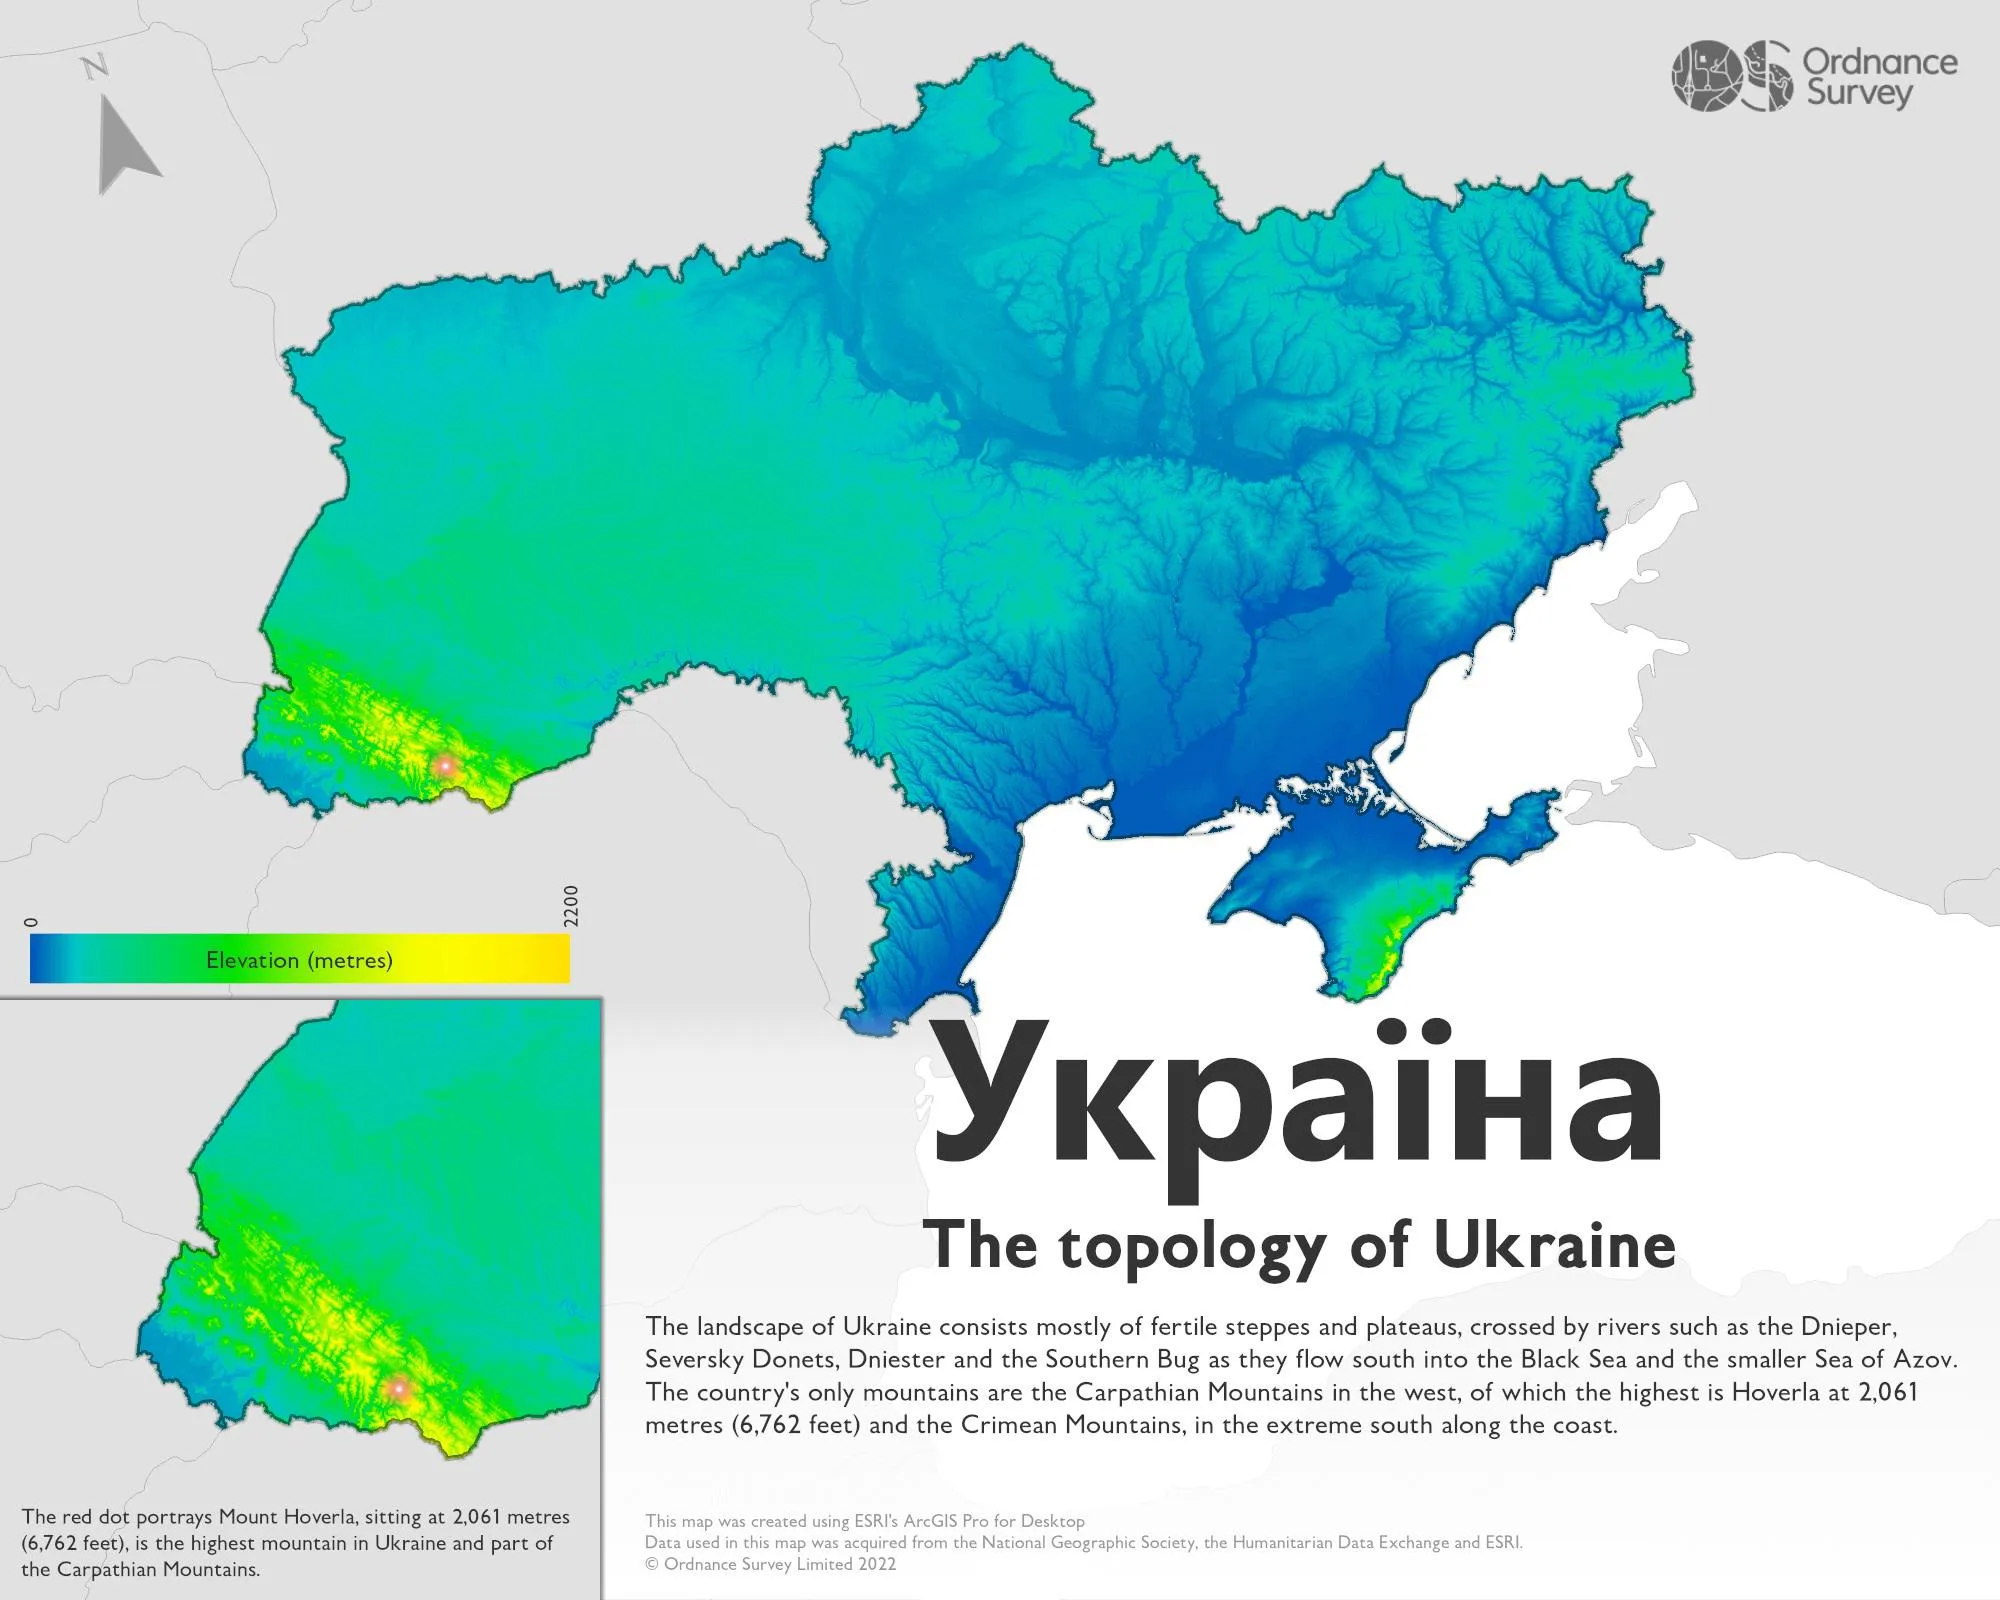
Україна - The topology of Ukraine, Myles Colling
A topology map of Ukraine, showing elevation in Ukrainian national colours. It is a very flat country!
OS Data used – N/A
Day 6 – Network
Layers of networks, Tom Peterken
Ordnance Survey’s transport networks are used to analyse connectivity in many different contexts on a massive range of physical scales. This entry shows the road, rail, tram, and water networks in and around Nottingham, and highlights them on large and small scales. A two-dimensional map looks nice, but it doesn’t show the full picture of connectedness. Here, the separate networks are illustrated as interconnected “layers” using a third dimension, highlighting interaction points – such as at railway stations – where travellers might swap from one layer of the network to another. The circular frame is inspired by the OS logo, which also features road and water networks. The animation was created in Python using matplotlib and geopandas using OS data.
OS Data used – Road Network, Rail Network, Water Network, OS MasterMap Topography Layer
Day 7 – Raster
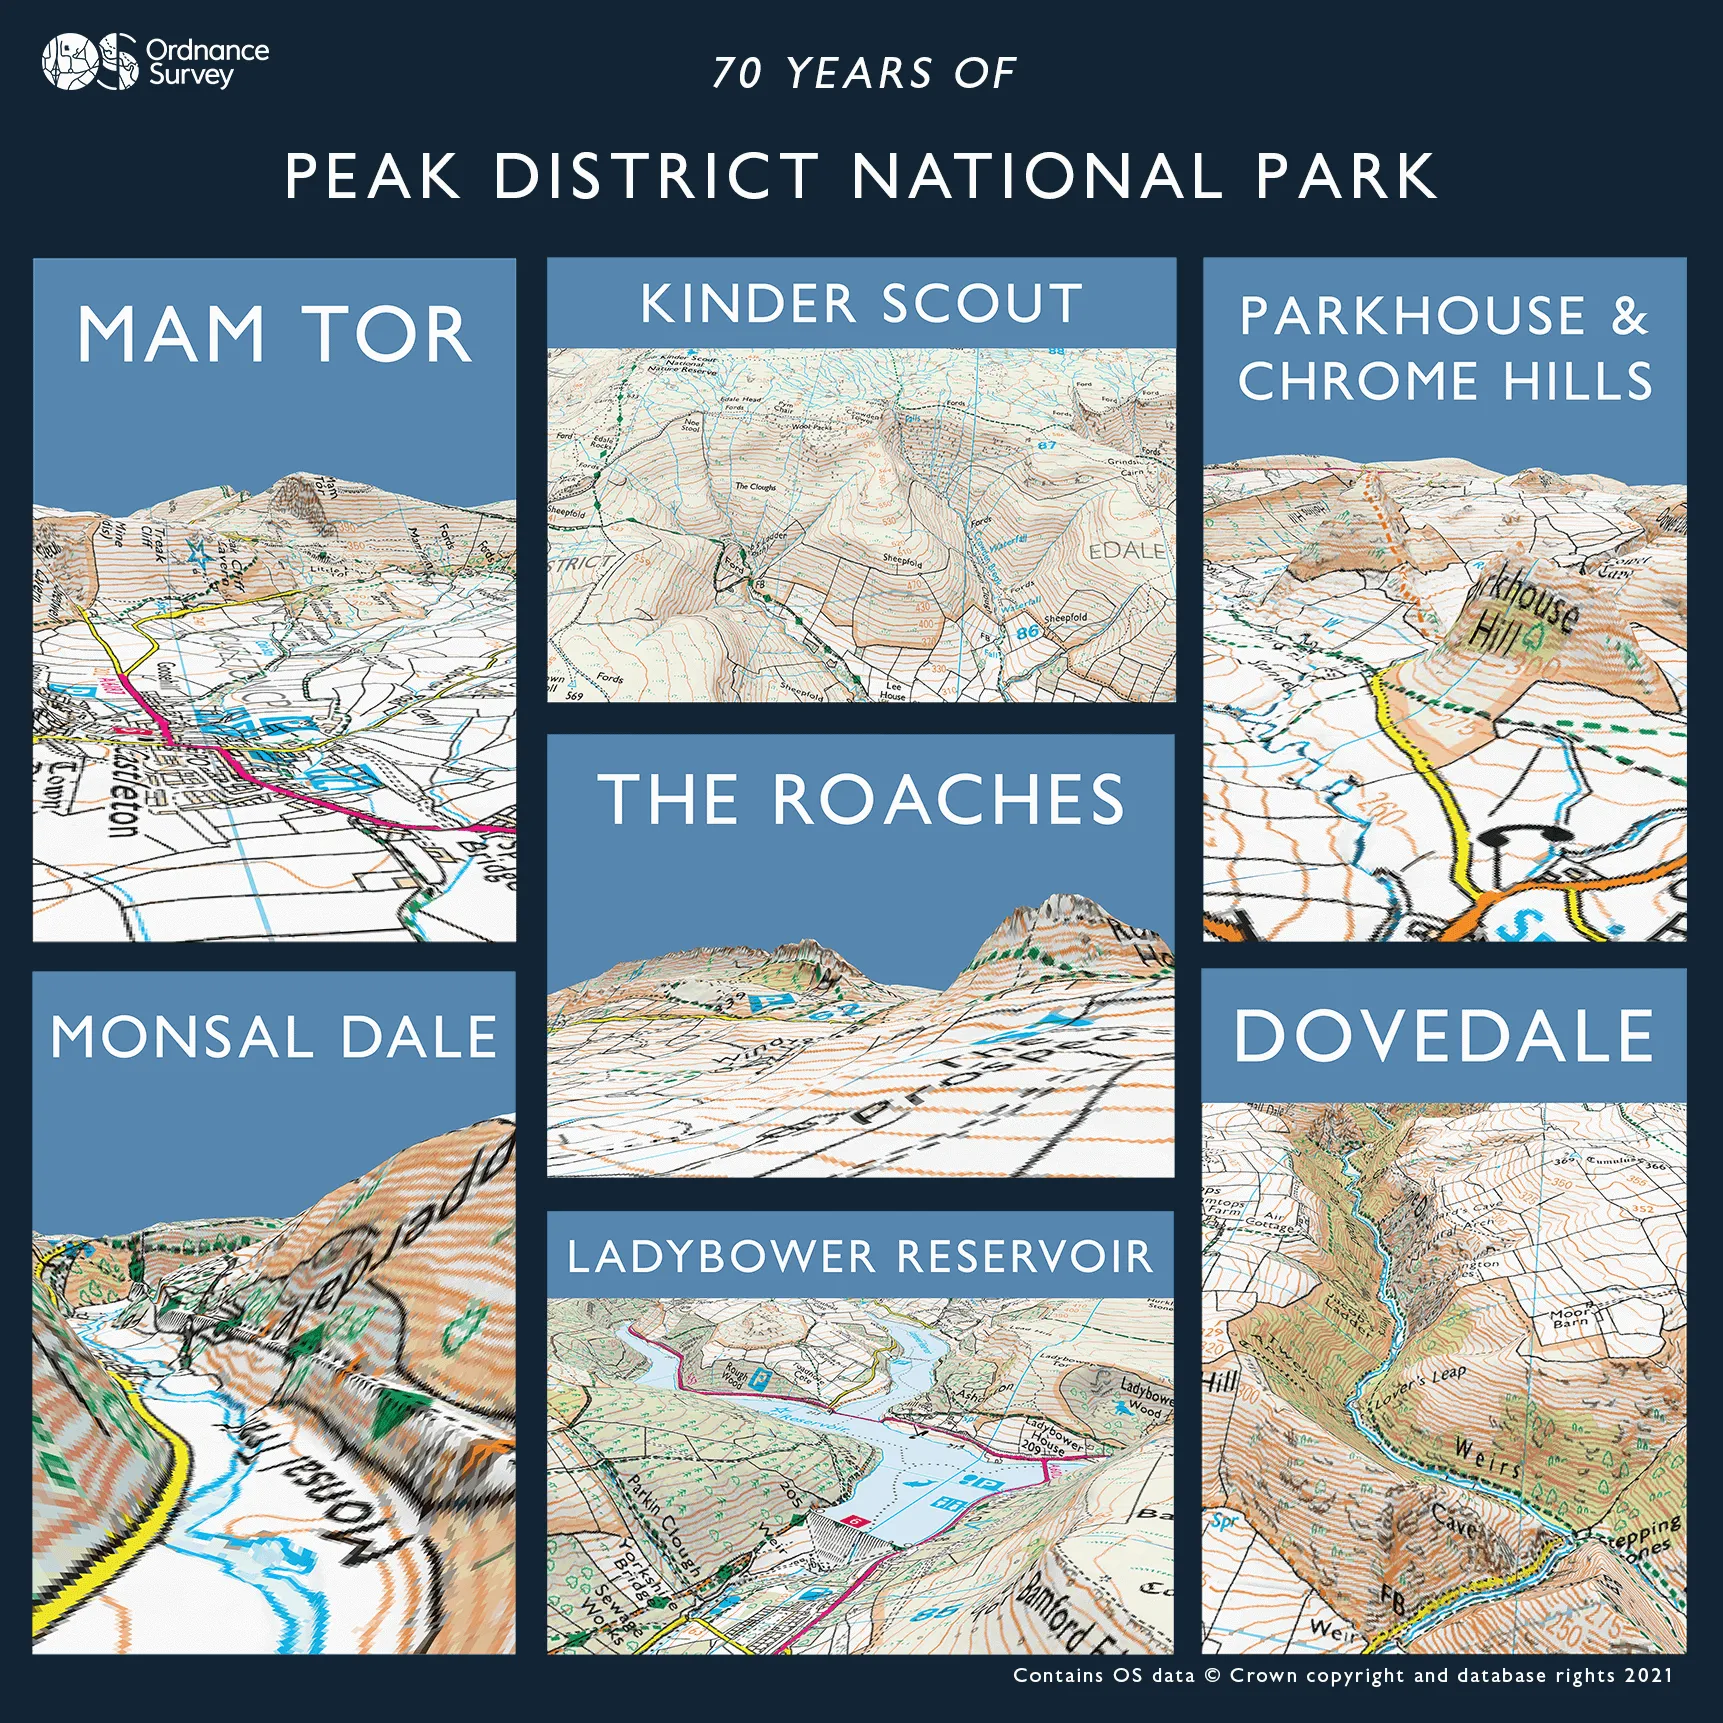
Celebrating 70 Years of the Peak District National Park, Katherine Featherstone
Last year, Katherine created these 'postcard' visualisations to celebrate 70 years of the Peak District National Park, which was designated on the 17th April 1951.
OS Data used – OS Terrain 5, 1:25 000 Scale Colour Raster
Day 8 – Data: OpenStreetMap
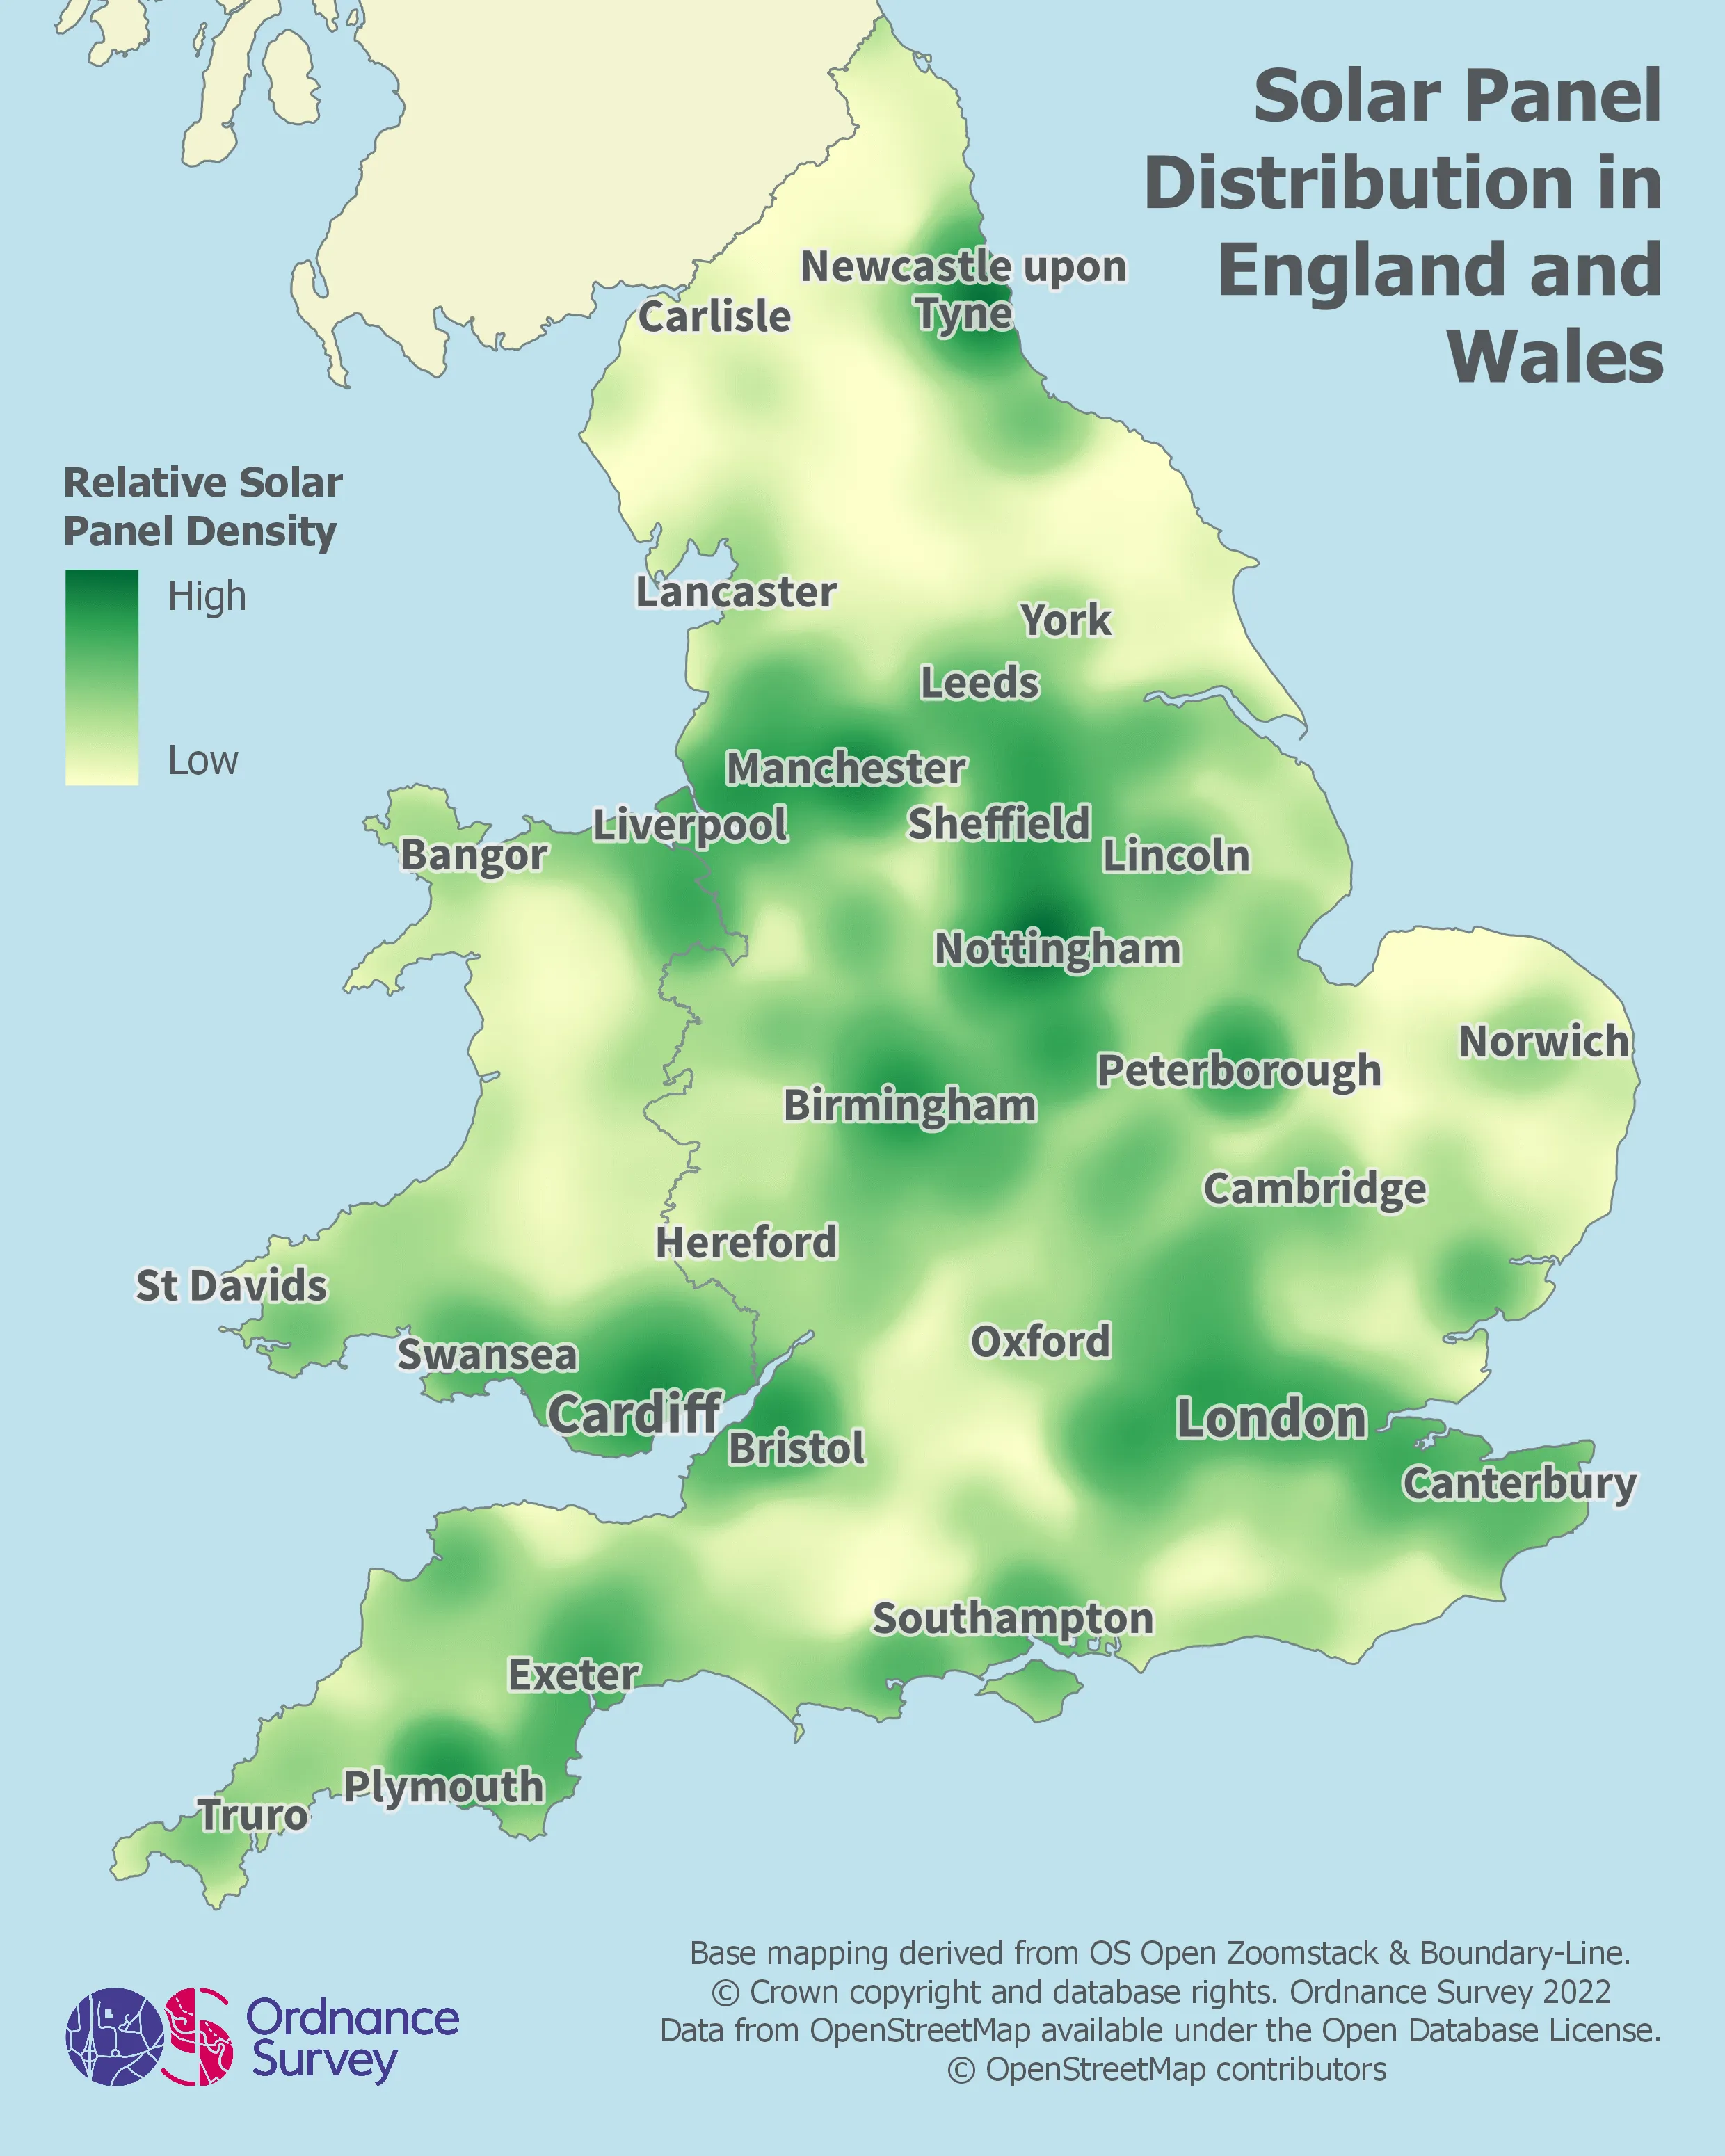
Solar Panel Distribution in England and Wales, Nate Meech
Collecting accurate national solar panel data is a huge challenge, to gain this broad overview I extracted all OpenStreetMap features with the tag generator:source=solar using their overpass turbo app. Polygons were converted to points and QGIS' Heatmap style used to visualise the data.
Due to the potential biases in this methodology and the inherent inconsistencies in open source data this representation is heavily generalised and qualitative in nature to give an overarching impression of panel distribution at a scale appropriate to the data integrity.
Interestingly this data suggests panel density is greatest in urban areas, presumably due to the massive increase in roof mounted panels seen in recent years.
OS Data used – Boundary-Line, OS Open Zoomstack
Day 9 – Space
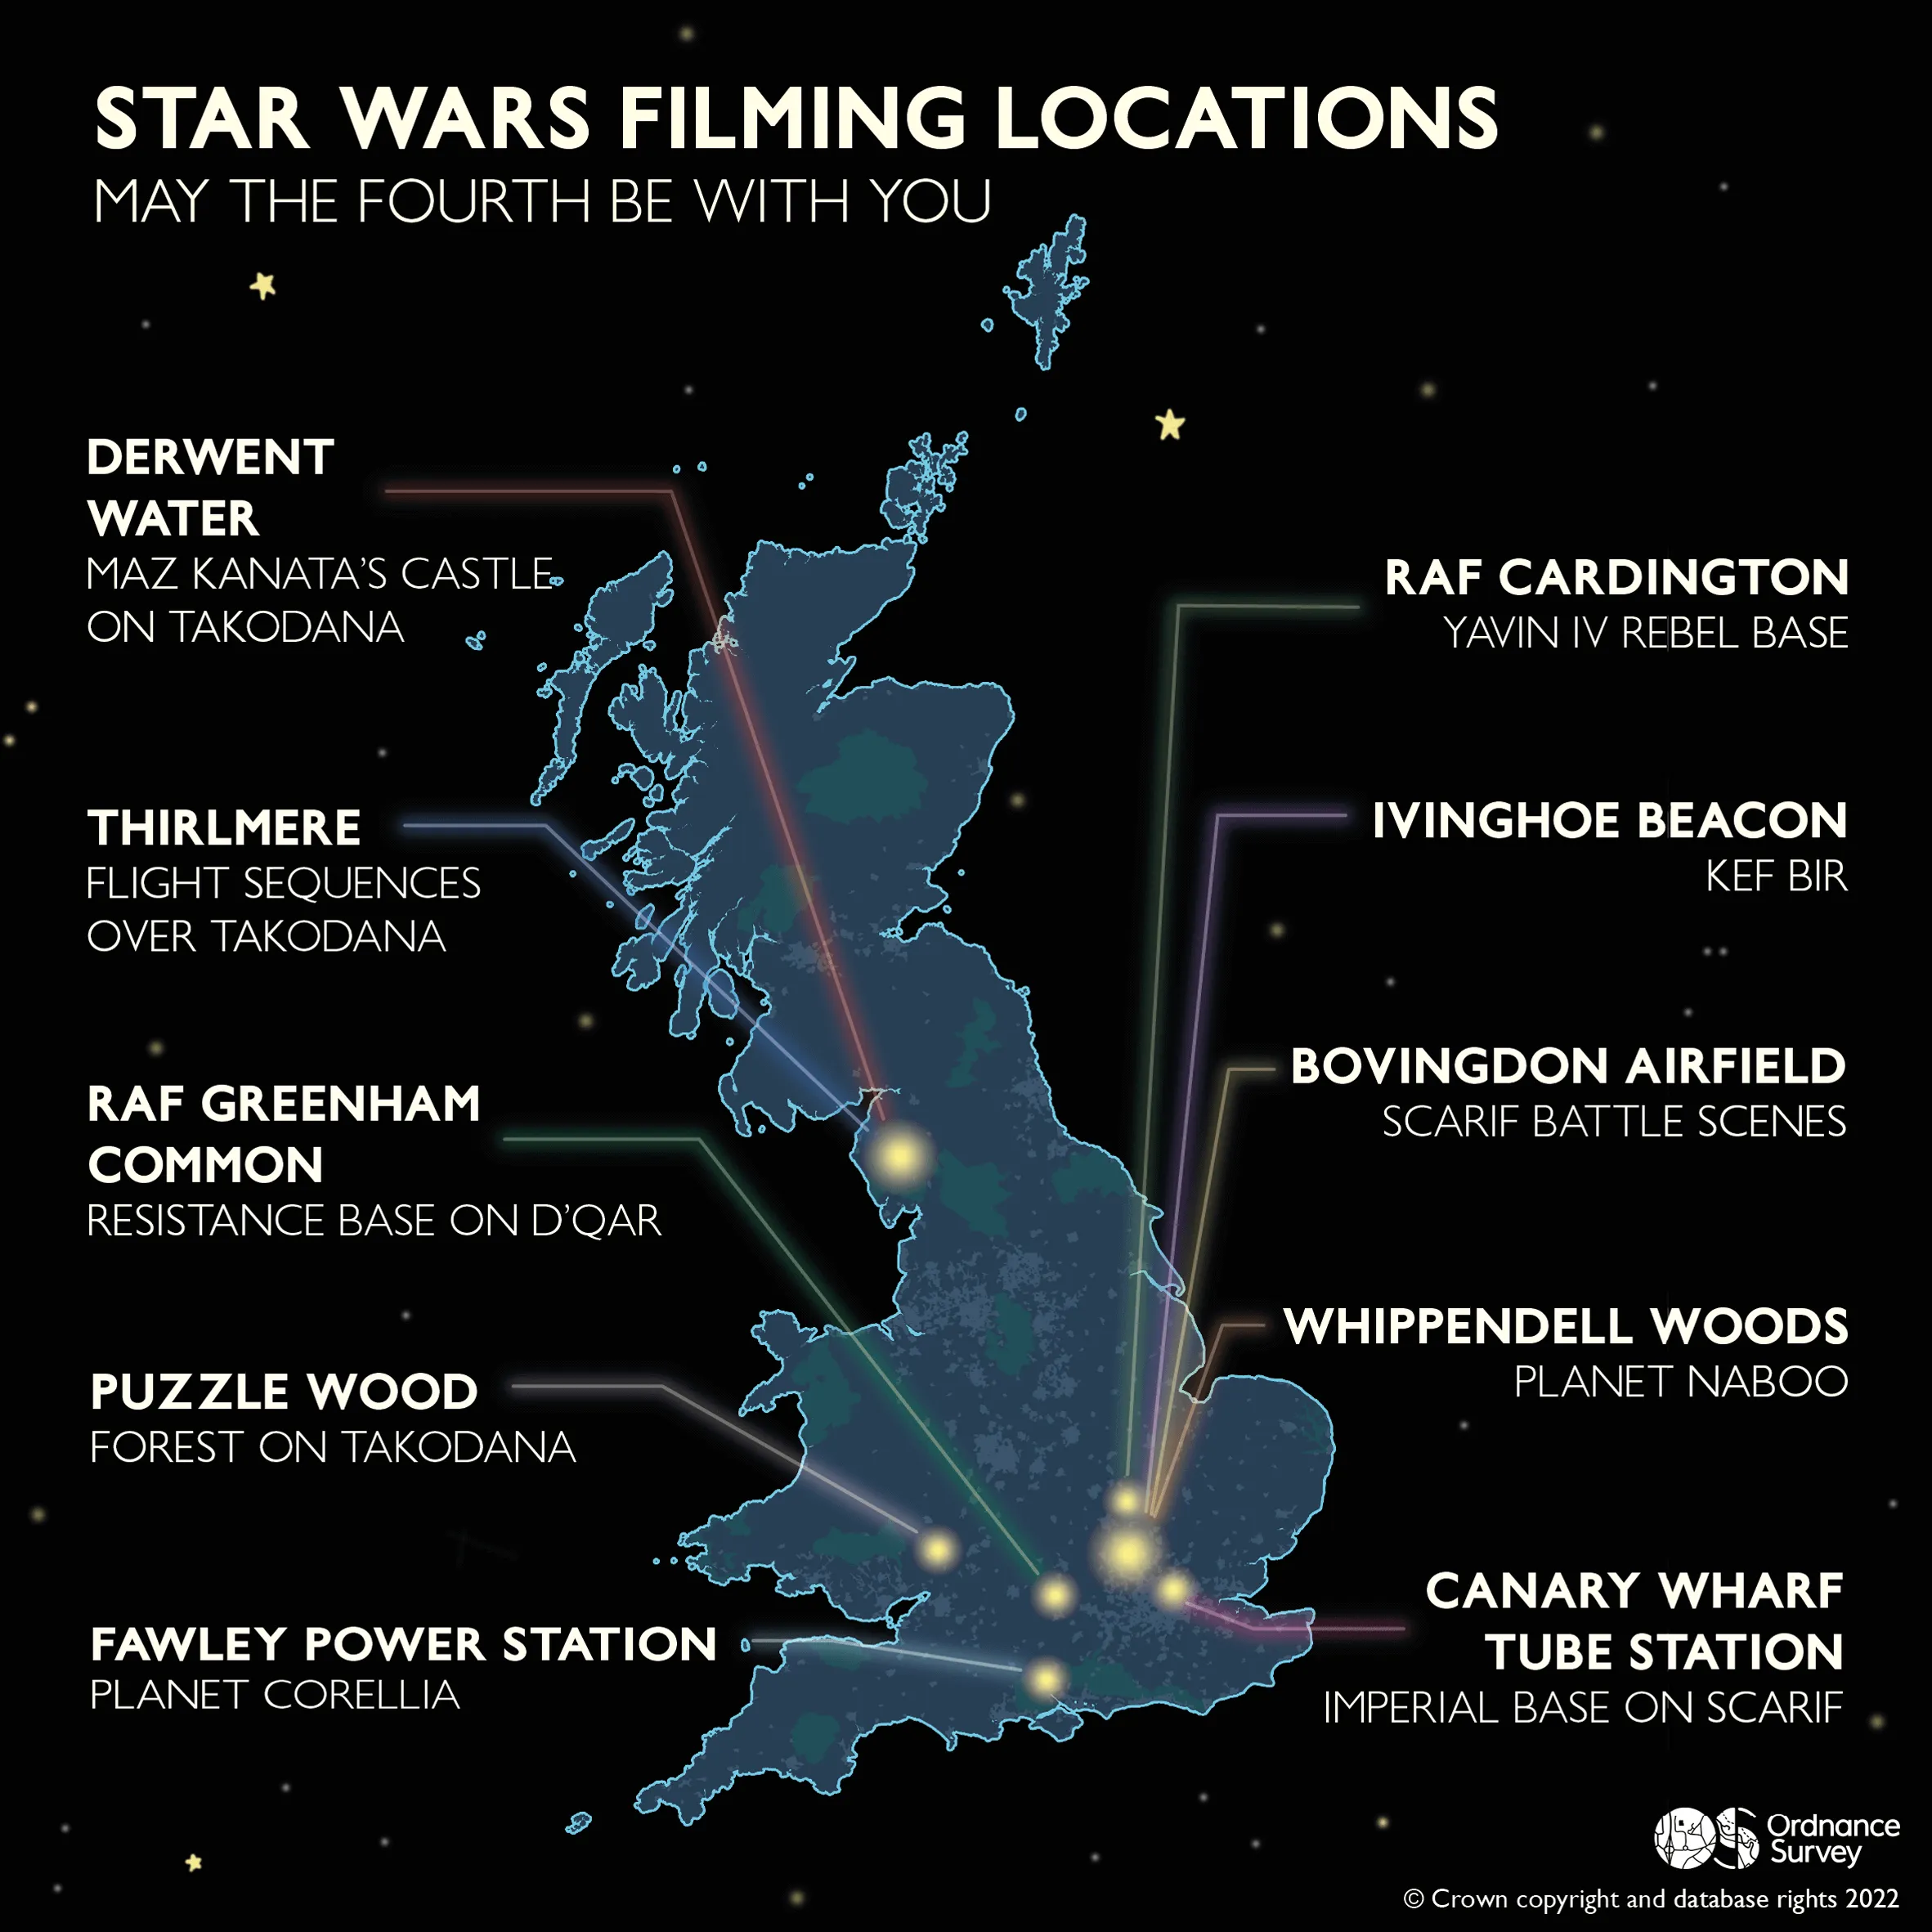
May the Fourth Be With You, Jessica Baker
Jess made this map for Star Wars Day (4th May) but couldn’t resist resharing for the ‘Space’ theme as it fits so well! They mapped the locations around Great Britain where the hugely popular Star Wars series has been filmed – did you know that Canary Wharf tube station was used as an imperial base? Or that Puzzle Wood was used as a forest on Takodana?
OS Data used – OS Open Zoomstack
Day 10 – A bad map
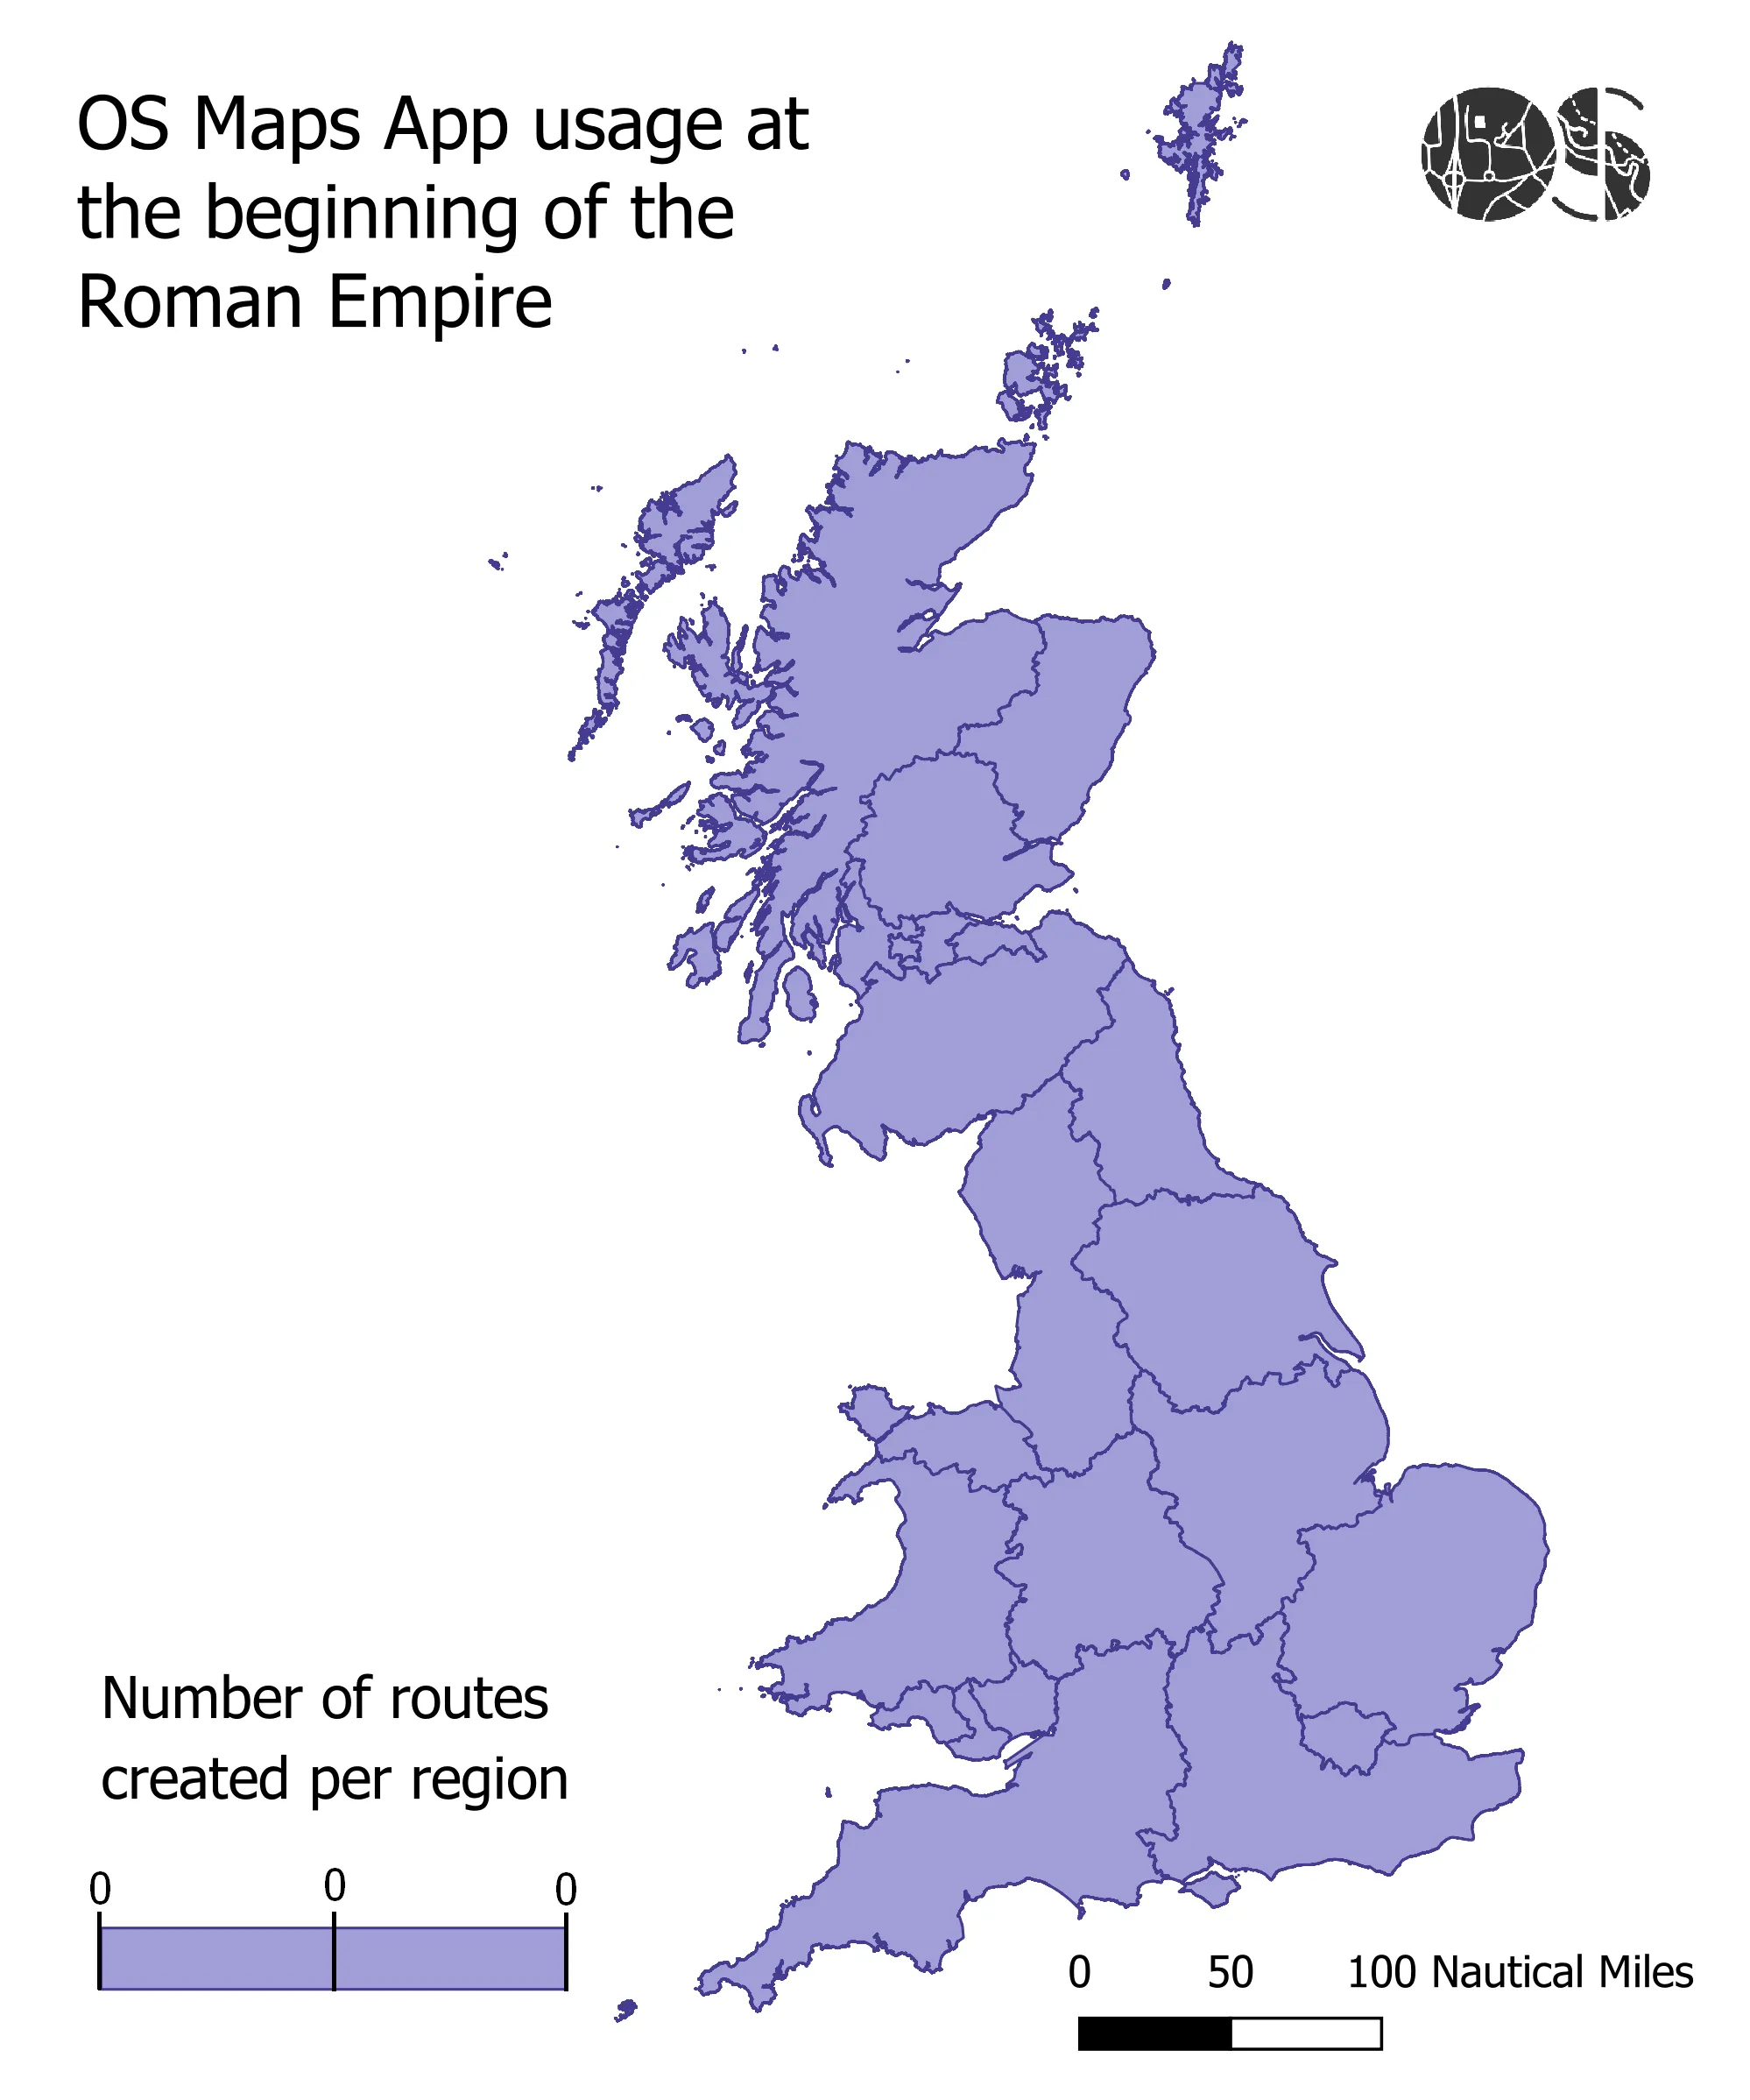
OS Maps App usage at the beginning of the Roman Empire, Mel Marochov
This extremely informative map shows the number of routes created on the OS Maps App at the beginning of the Roman Empire.
OS Data used – Boundary-Line
Day 11 – Colour Friday: Red
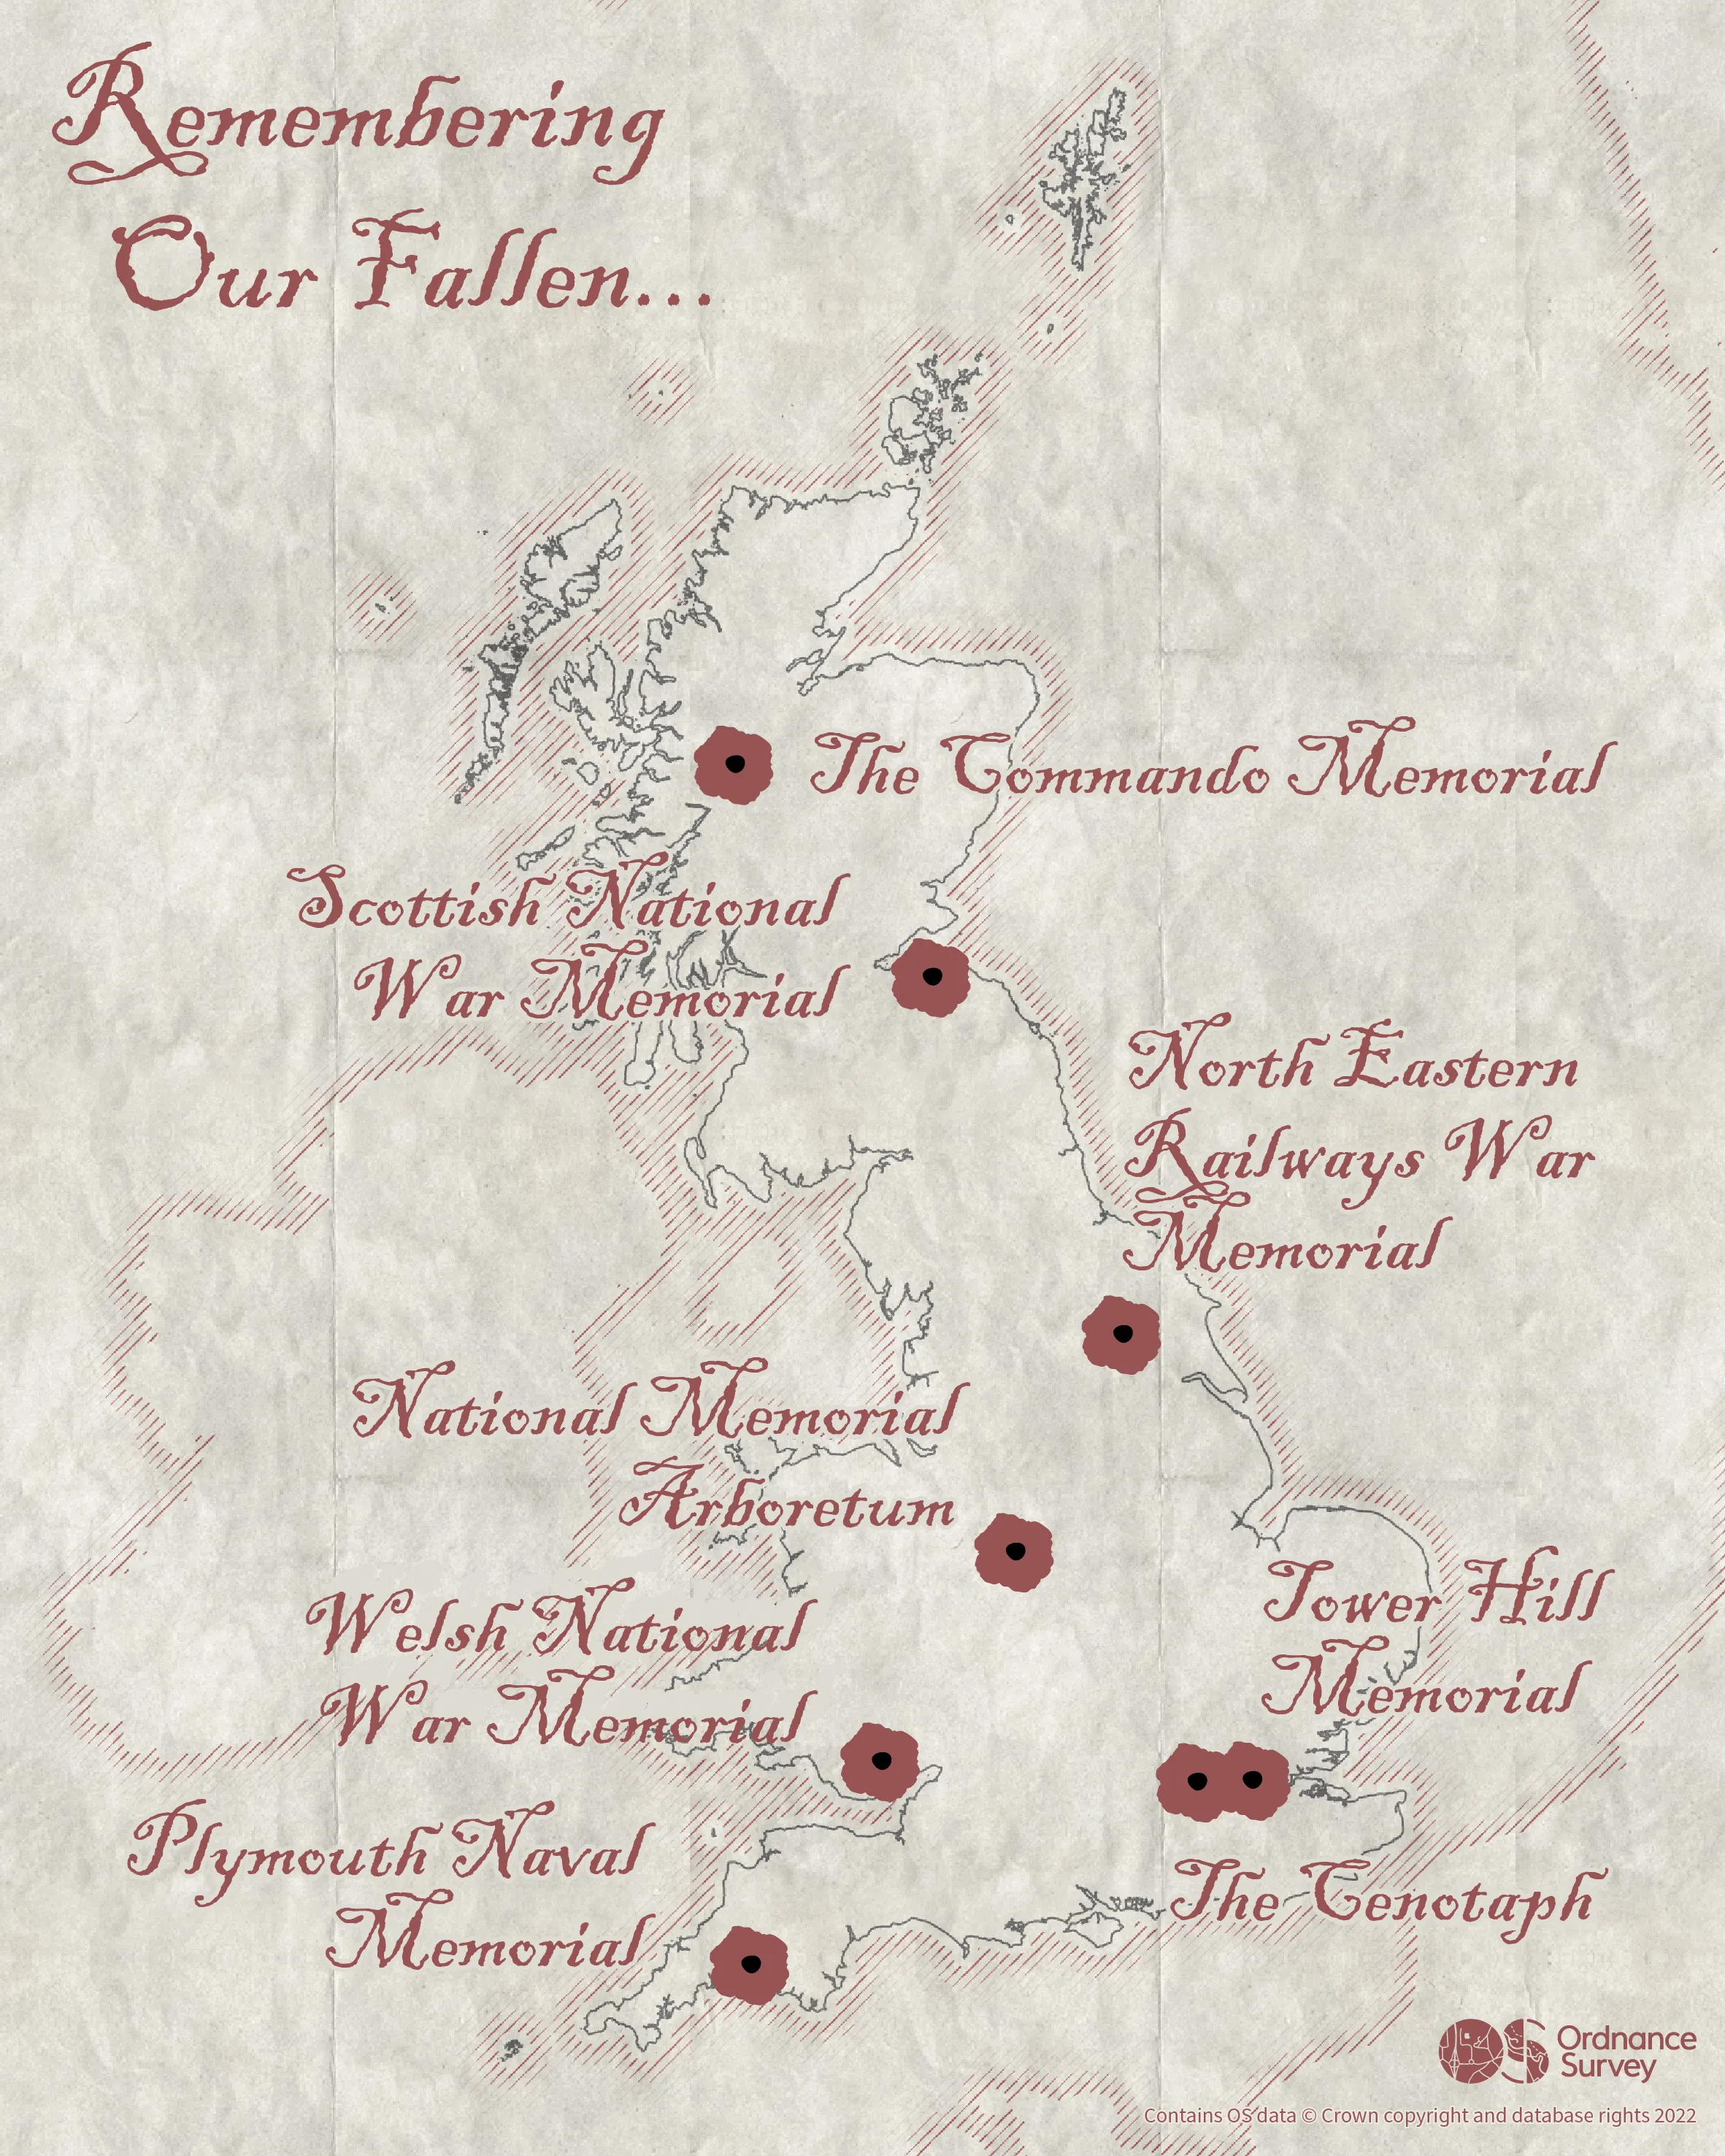
Remembering Our Fallen, Paul Naylor
After the end of the First World War, the people of Britain needed a focus for their grief, loss and pride. War memorials were erected across Great Britain and form an important part of our rich cultural heritage and connect us with the global conflict that shaped the world we live in today.
This map depicts a selection of some of those amazing War Memorials of Great Britain.
OS Data used – Boundary-Line, OS Open Zoomstack
Day 12 – Scale
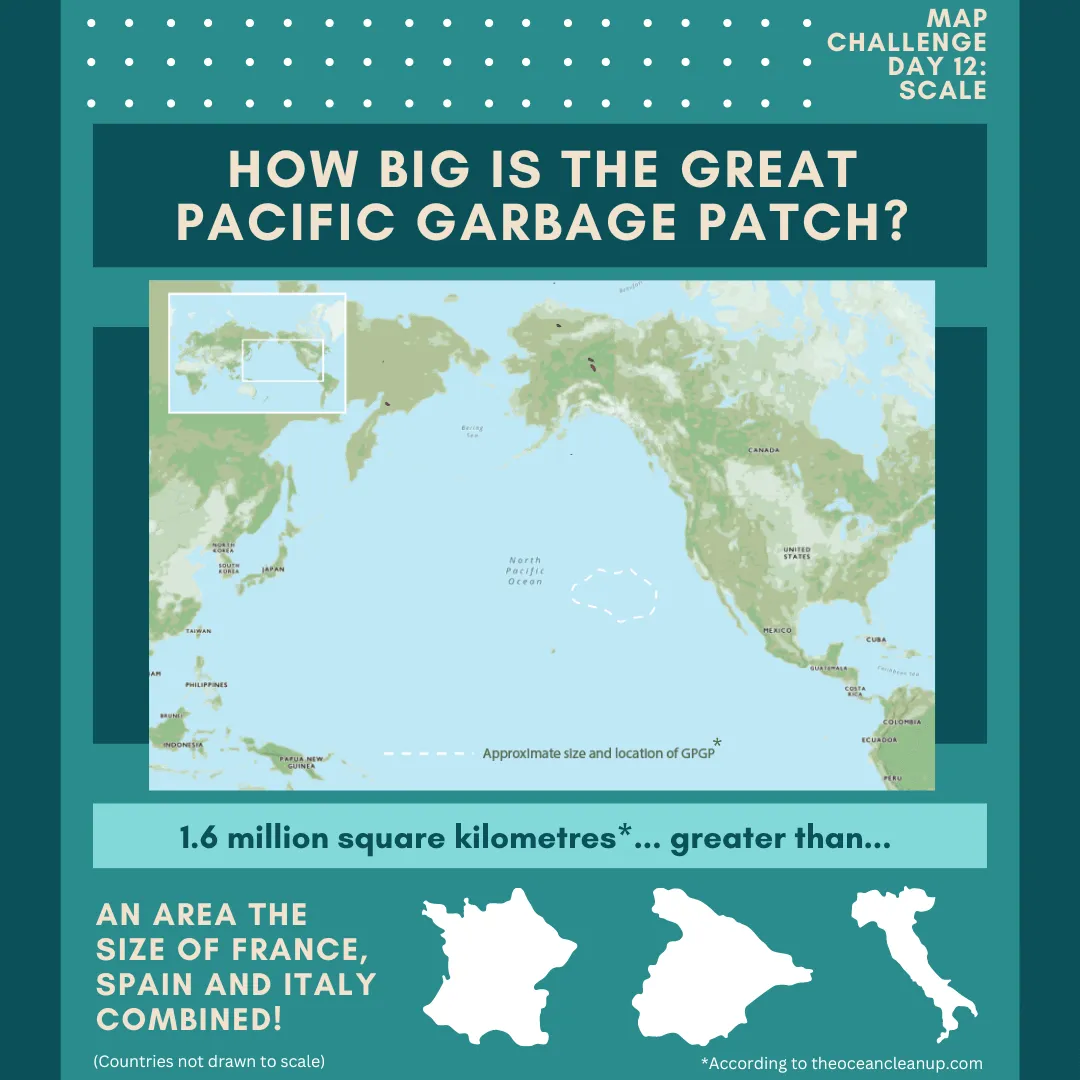
How Big is the Great Pacific Garbage Patch?, Ben Attwood
Created by the convergence of ocean currents carrying sea level debris (mainly plastic), the Great Pacific Garbage Patch is the largest accumulation of debris at the ocean surface in the world. It’s location and size vary with seasonal fluctuations in current. This has meant that specific measurements are incredibly difficult to attain. Though, best guesses have put the size in the region of 1.6million km2.
Map data has been drawn from OS Maps Standard Map and information on the GPGP has come from theoceancleanup.com
OS Data used – OS Maps app ‘Standard Map’
Day 13 – 5 minute map
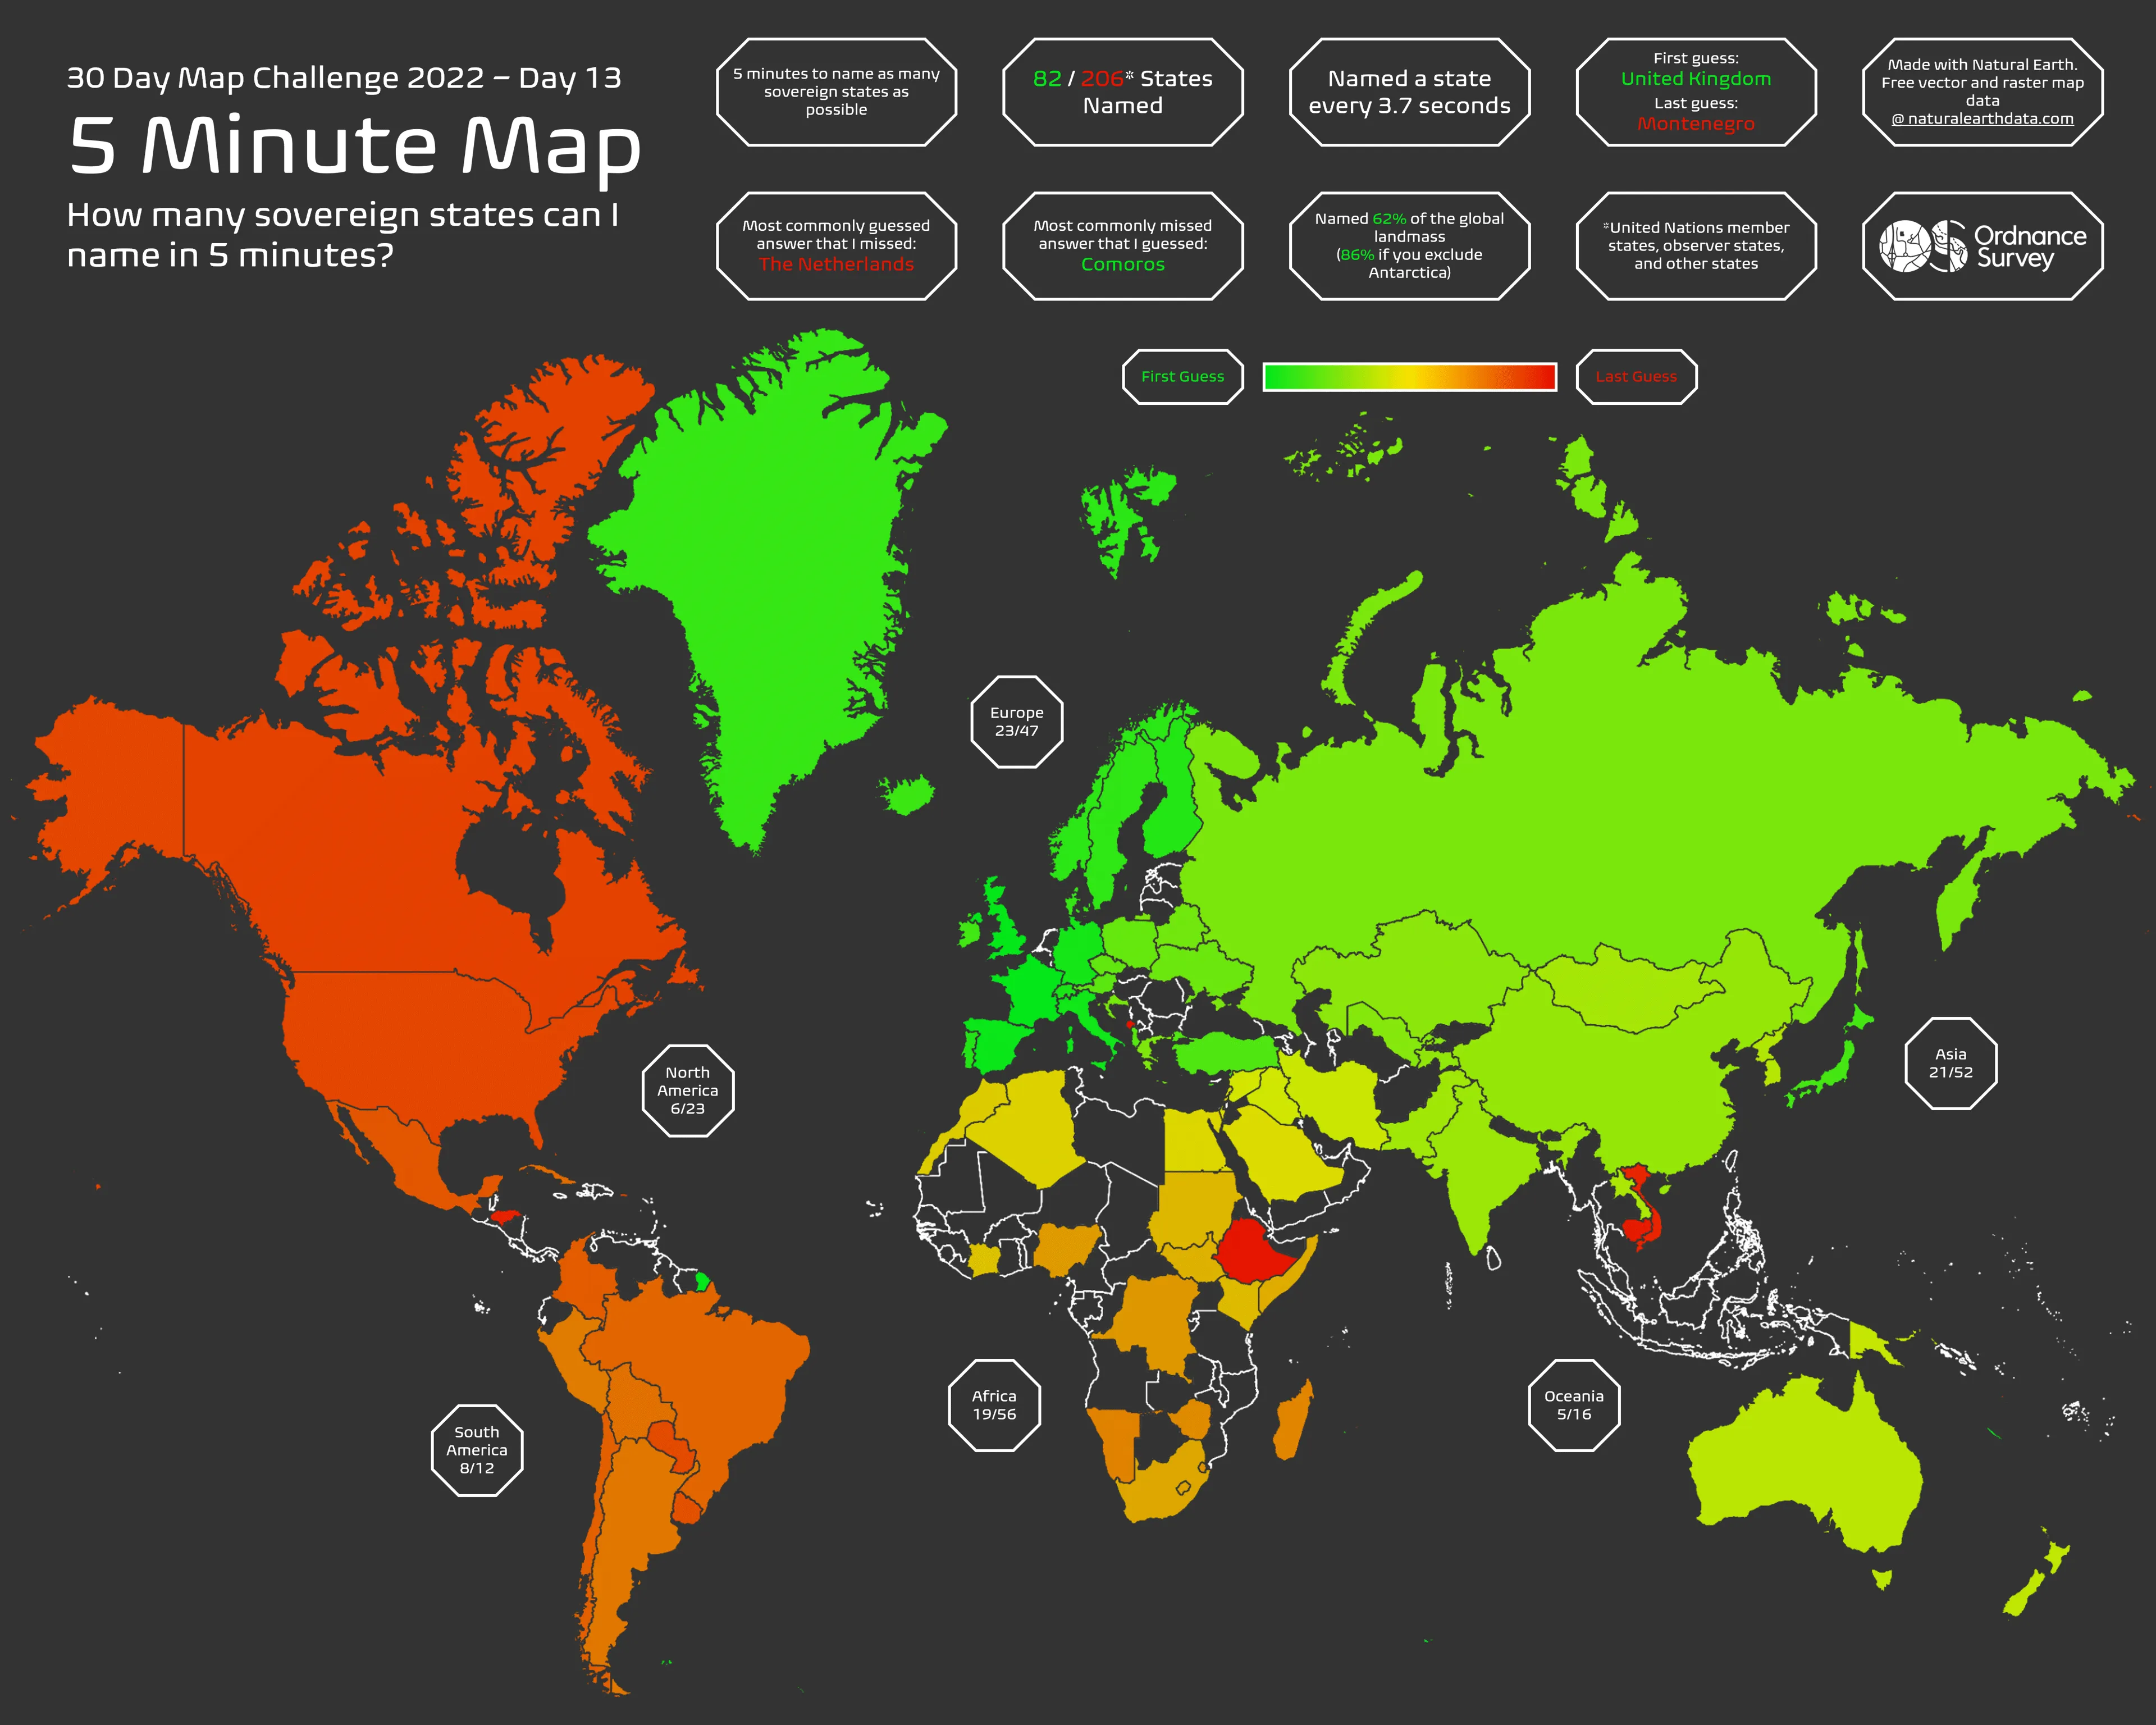
How many sovereign states can I name in 5 minutes?, James Armstrong
To make this map, James challenged himself to name as many countries as he could in 5 minutes (with no map or prep to help). The list of possible countries was based on the official United Nations member states, observer states, and disputed states.
He was able to name 82 out of 206 states, approximately one every 3.7 seconds. The colours represent the order of guesses, from green for first guesses to red for last guesses
The map itself was made entirely using Natural Earth Data in QGIS.
OS Data used – N/A
Day 14 – Hexagons (we had 2 entries for this day)
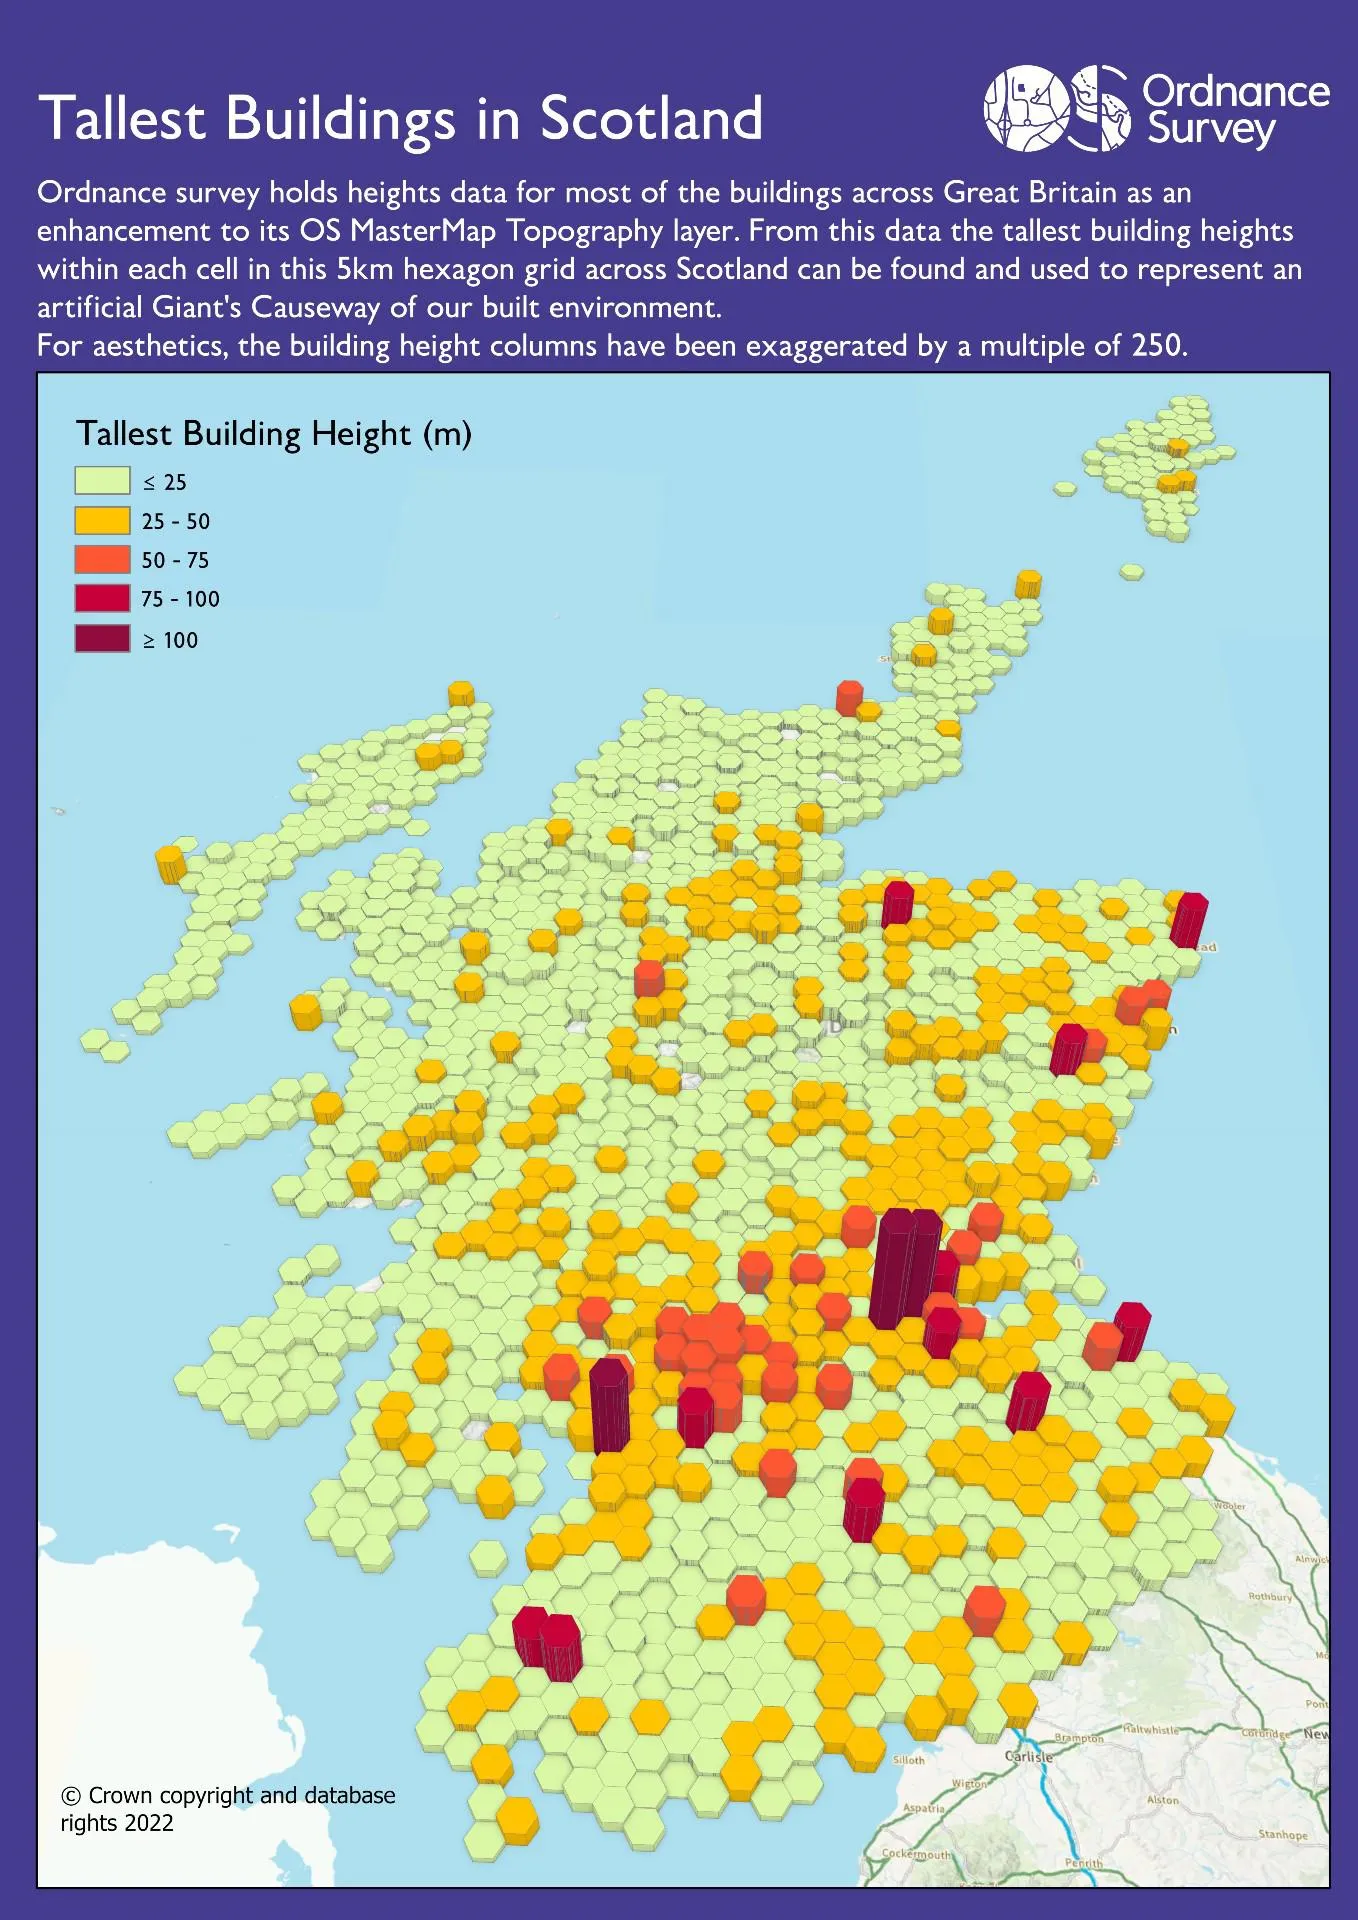
Tallest Buildings in Scotland, Brian Johnston
Ordnance Survey holds height data for most of the buildings across Great Britain as an enhancement to its OS MasterMap Topography Layer. From this data the tallest building heights within each cell in this 5km hexagon grid across Scotland can be found and used to represent an artificial Giant’s Causeway of our built environment.
For aesthetics, the building height columns have been exaggerated by a multiple of 250.
OS Data used – OS MasterMap Topography Layer (Building Height Attributes), OS Maps API
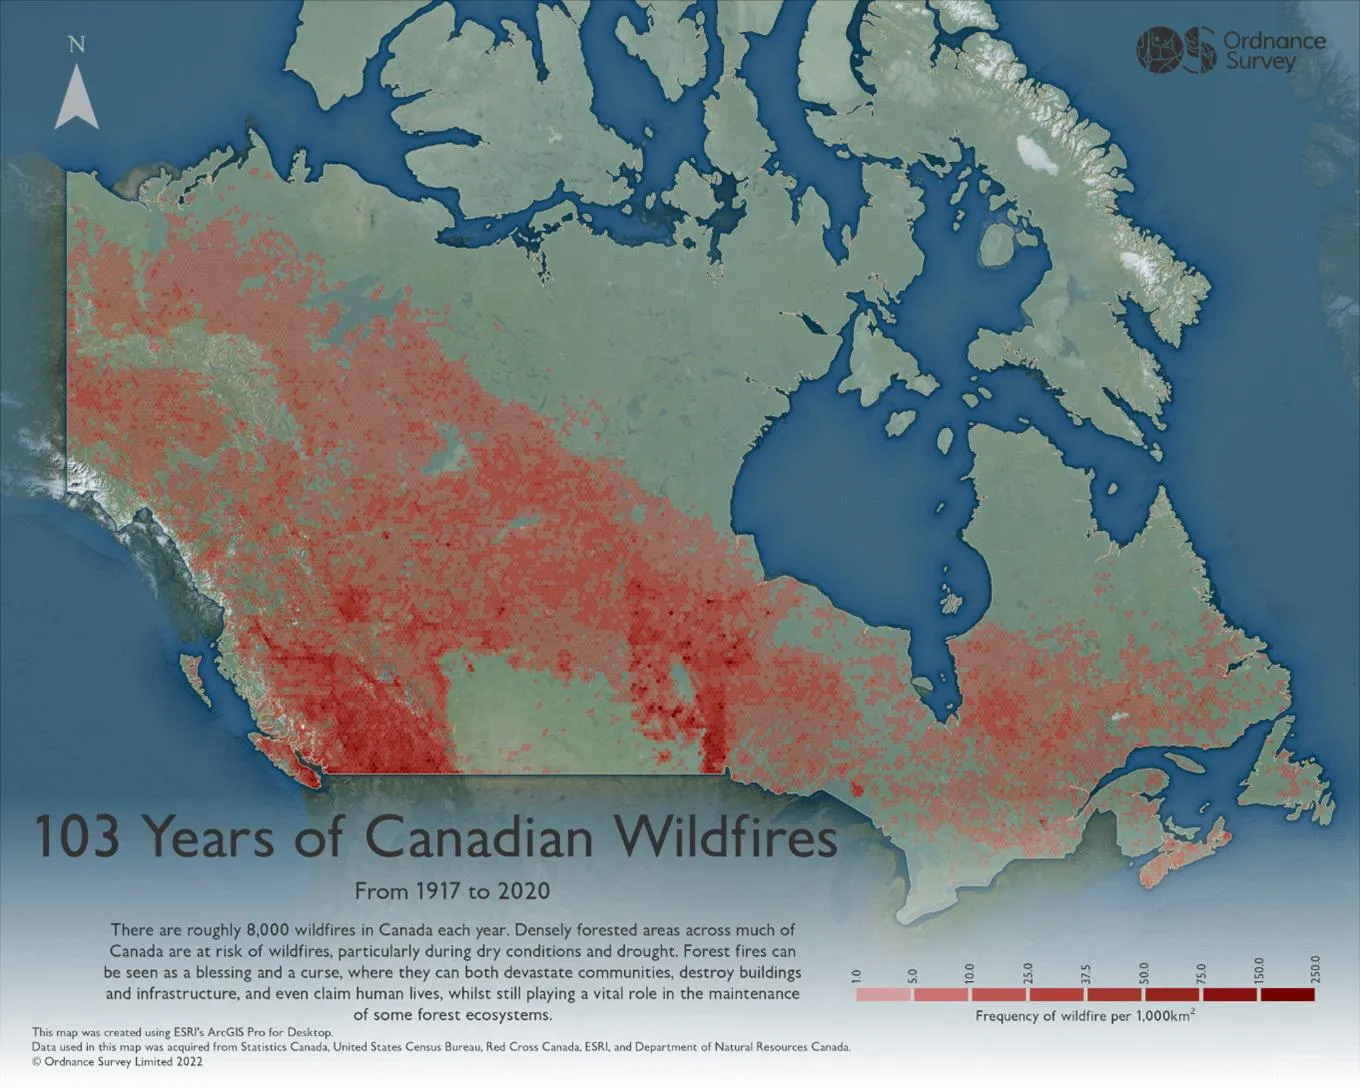
103 Years of Canadian Wildfires – From 1917 to 2020, Myles Colling
This map depicts 103 years of Canadian Wildfires expressed in a transverse hexagonal tessellation pattern, showing variation in wildfire frequency through change in lightness and saturation.
OS Data used – N/A
Day 15 – Food/drink
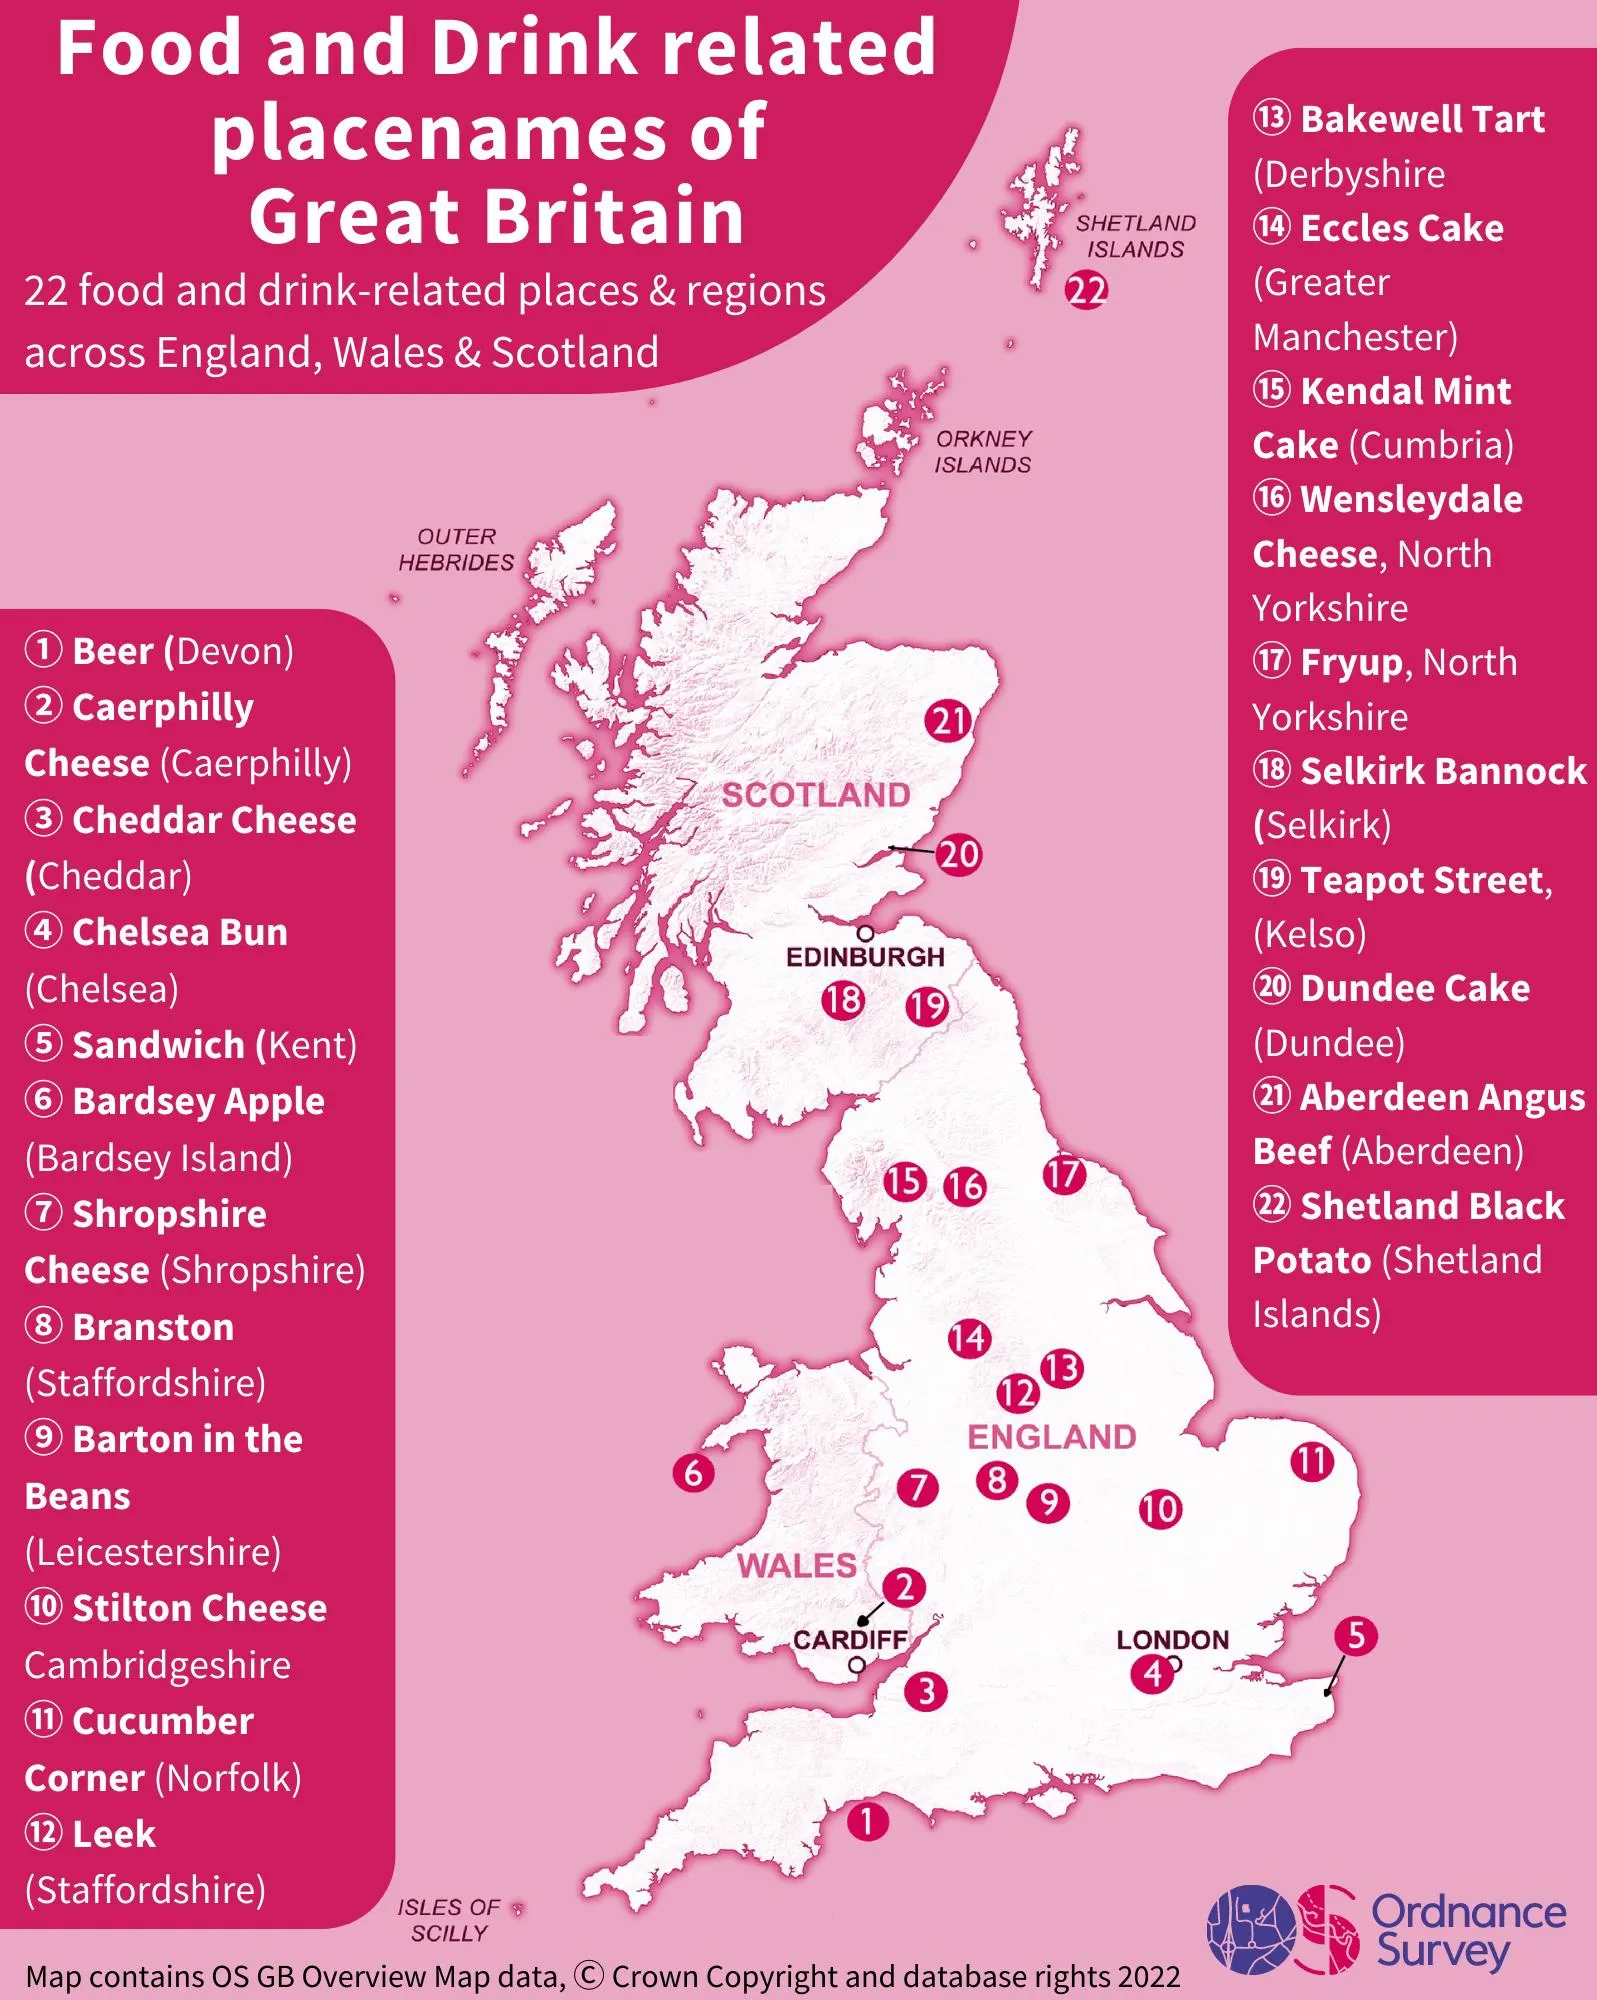
Food and Drink related placenames of Great Britain, Jacob Kilby
A map where either where the place is associated with a particular food or drink, or where its placename sounds food related.
OS Data used – OS Open Zoomstack, AddressBase
Day 16 – Minimal
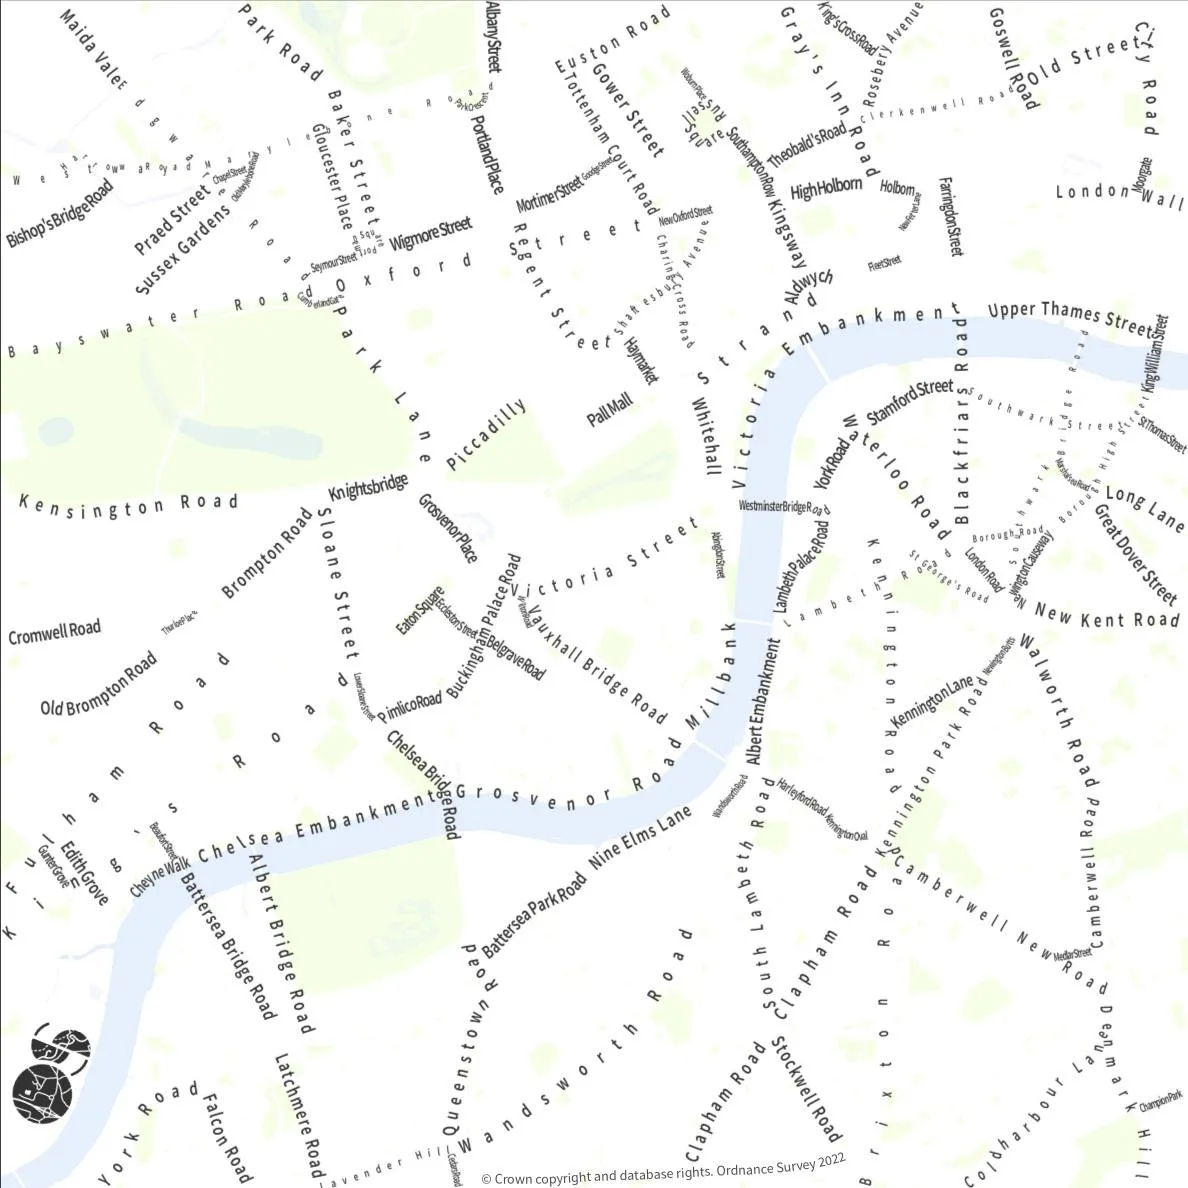
Central London road map, Freya Cooper
A roadmap on central London but not as you know it! This map uses the street names instead of road lines from OS Open Roads to create the road network throughout the city.
How many Monopoly names can you find?
OS Data used – OS Open Roads, OS MasterMap Topography Layer

Day 17 – A map without a computer (we had 2 entries for this day)
OS Graduate Mel Marochov created this lit map of Europe in the form of a candle. She made the candle with natural soy wax and fallen autumn leaves from the New Forest. The process required lots of patience, especially since southern Europe seemed intent on sinking.
When it’s lit and the wax begins to melt, the continents start to shift to form a new Pangaea – and just like your average map, it smells of gingerbread!
OS Data used – N/A

A meddo stick chart of my regular commutes in & around Bath & the surrounding area, Richard Hargreaves
Inspired by the Marshallese Stick Charts used to navigate between the islands of the Pacific, Richard has made a ‘Meddo’ chart conveying his personal commutes in and around Bath and the surrounding area. It was produced from a mental map of journeys, and similarly to Marshallese charts is most relevant to the maker themselves.
OS Data used – N/A
Day 18 – Colour Friday: Blue
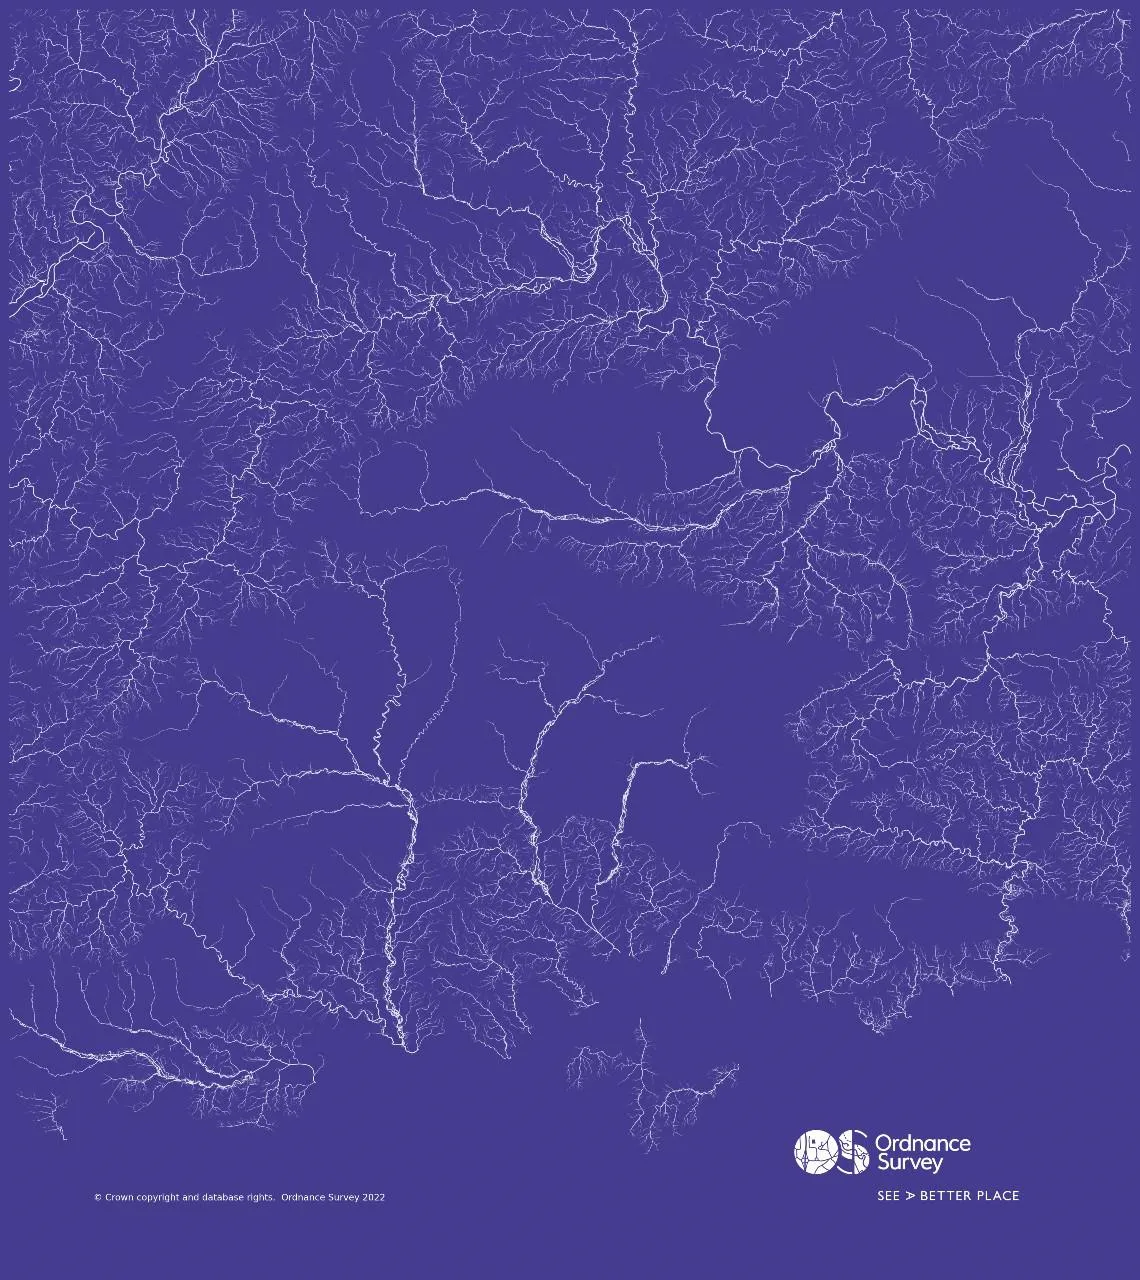
Blue waters, Tom Peterken
Today’s map shows the rivers in our local part of England, including the basins of the Test, two different Avons, two different Yars, one of the many Stours, a small part of the Severn, a large portion of the Thames, and many others. The line thicknesses are defined by counting how many river segments there are upstream in each river network. The mapmaker, Tom, loves this view because the chalky downs really stand out where the streams are absent! It was created using graphframes, networkx, and matplotlib in Python/Databricks.
OS Data used - Water network
Day 19 – Globe
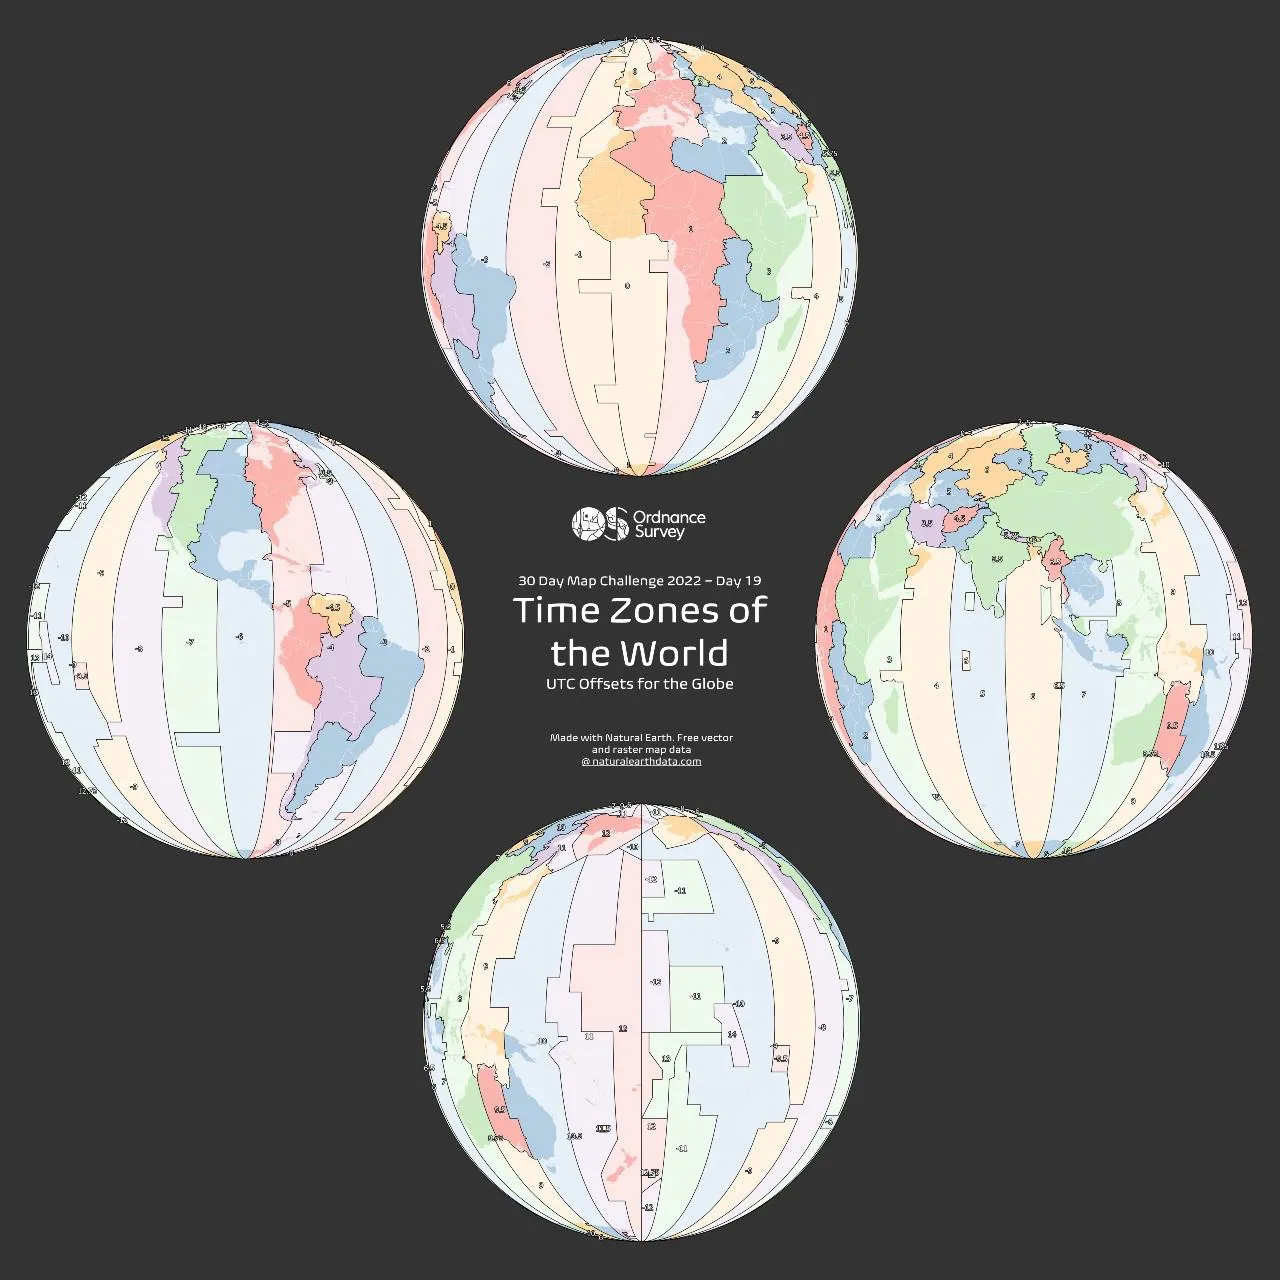
Time Zones of the World, James Armstrong
Time zones of the world displayed on a globe, with boundaries and labels representing the time offset from Coordinated Universal Time (UTC). e.g. +4 is +4:00 hours
The map was made entirely using Natural Earth Data in ArcGIS Pro.
OS Data used – N/A
Day 20 – “My favourite” (we had 2 entries for this day)
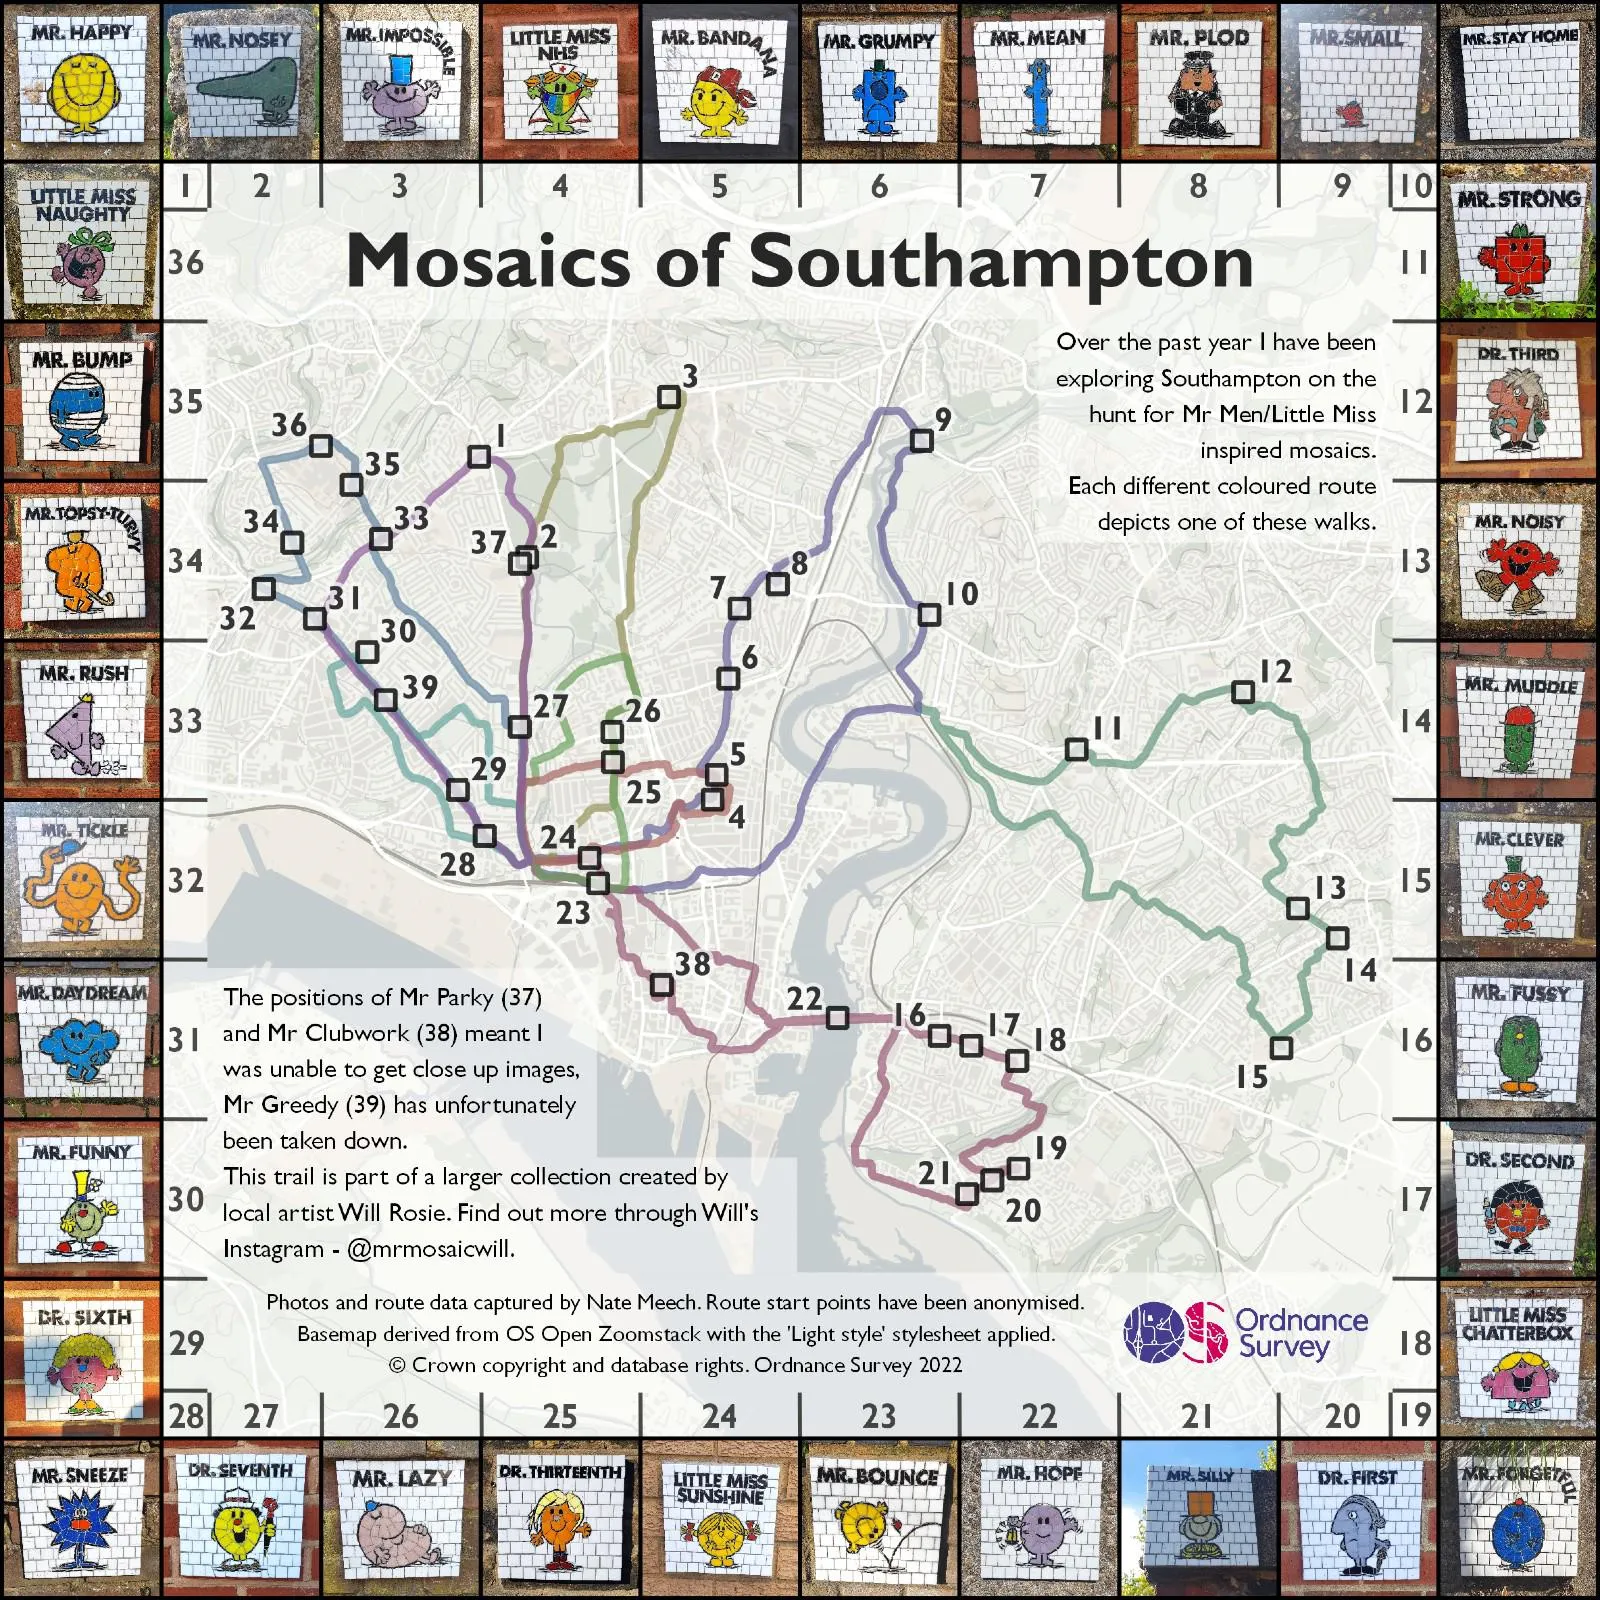
Mosaics of Southampton, Nate Meech
Mapmaker Nate’s favourite thing about Southampton is the work of local 'gorilla artist' Will Rosie. Will has been installing mosaics across the city since 2019 with a variety of inspirations, from The Simpsons to Superheroes and even the Southern Brave Cricket Team.
Having moved to Southampton a little over a year ago he has been using the Mosaic Trails as a way to get to know the city. This map depicts a series of walks he did visiting Will’s Mr Men / Little Miss inspired work.
You should check the artist out on Instagram (@mrmosaicwill) where he posts cryptic messages of new installations for people to hunt down. He has also started running workshops where you can make your own mosaic, one of which Nate was lucky enough to attend recently and can highly recommend!
OS Data used – OS Open Zoomstack
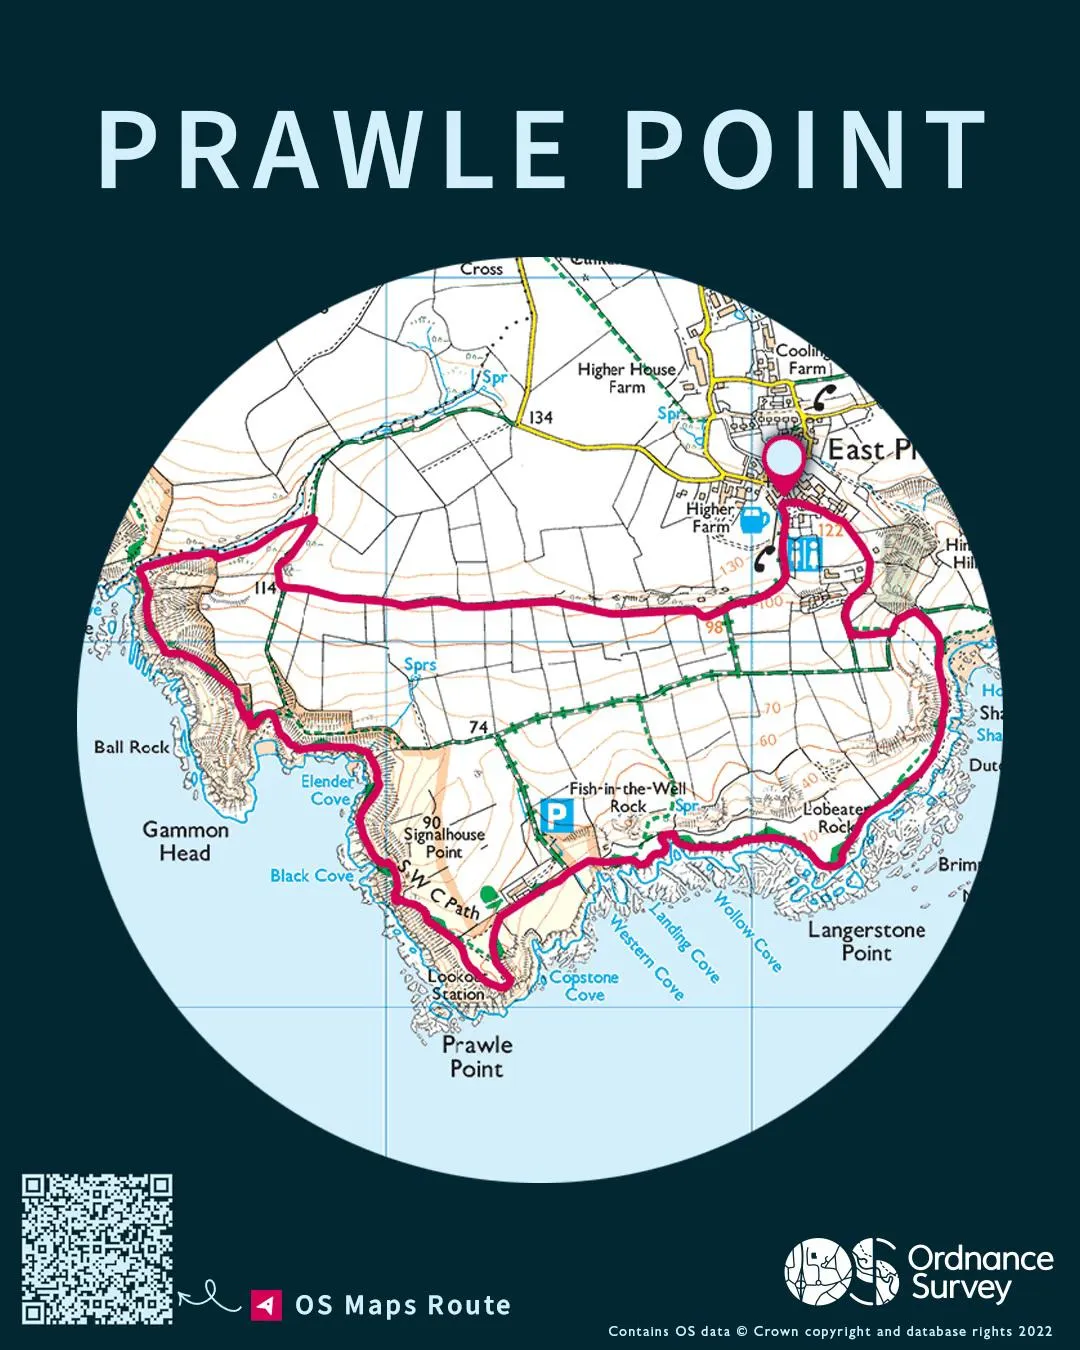
My favourite route: Prawle Point, Katherine Featherstone
Living in Devon for a couple of years and spending lots of time exploring the local area, this walk at Prawle Point stands out as one of Katherine’s all-time favourites. Situated on the beautiful South-West Coastal Path and the most southerly point in Devon, this walk includes views across the English Channel, turquoise water, secluded coves perfect for a swim and coastal flora and fauna. What's not to like?
Scan the QR code or find the route here.
OS Data used – 1:25 000 Scale Colour Raster, OS Maps GPX route file
Day 21 – Data: Kontur Population Dataset
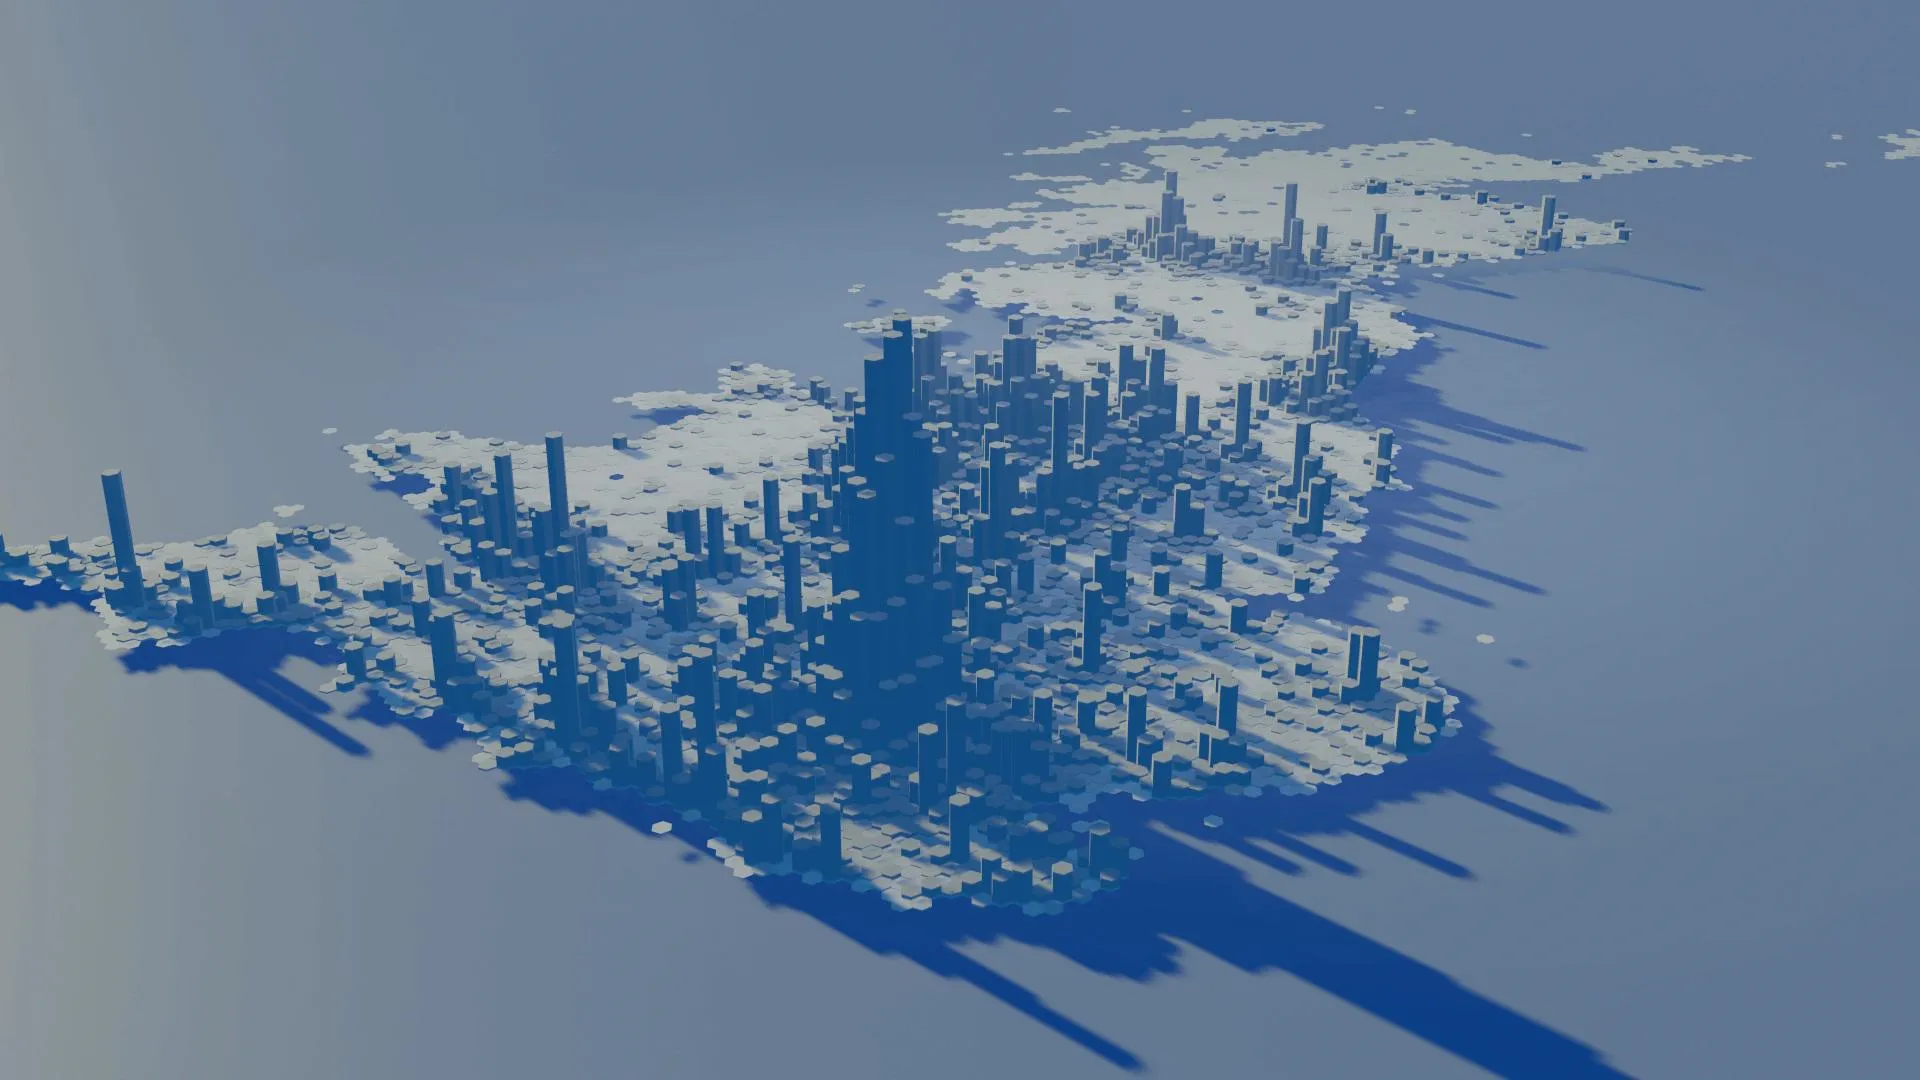
Kontur Population Data for GB, Jamie Young
The Kontur Population dataset (Population dataset (kontur.io)) shows population density for the whole globe on a hexagonal grid. This image presents the population data for GB and renders each hexagon as a tower. The data was extracted in Python and visualised in Blender.
OS Data used – N/A
Day 22 – NULL
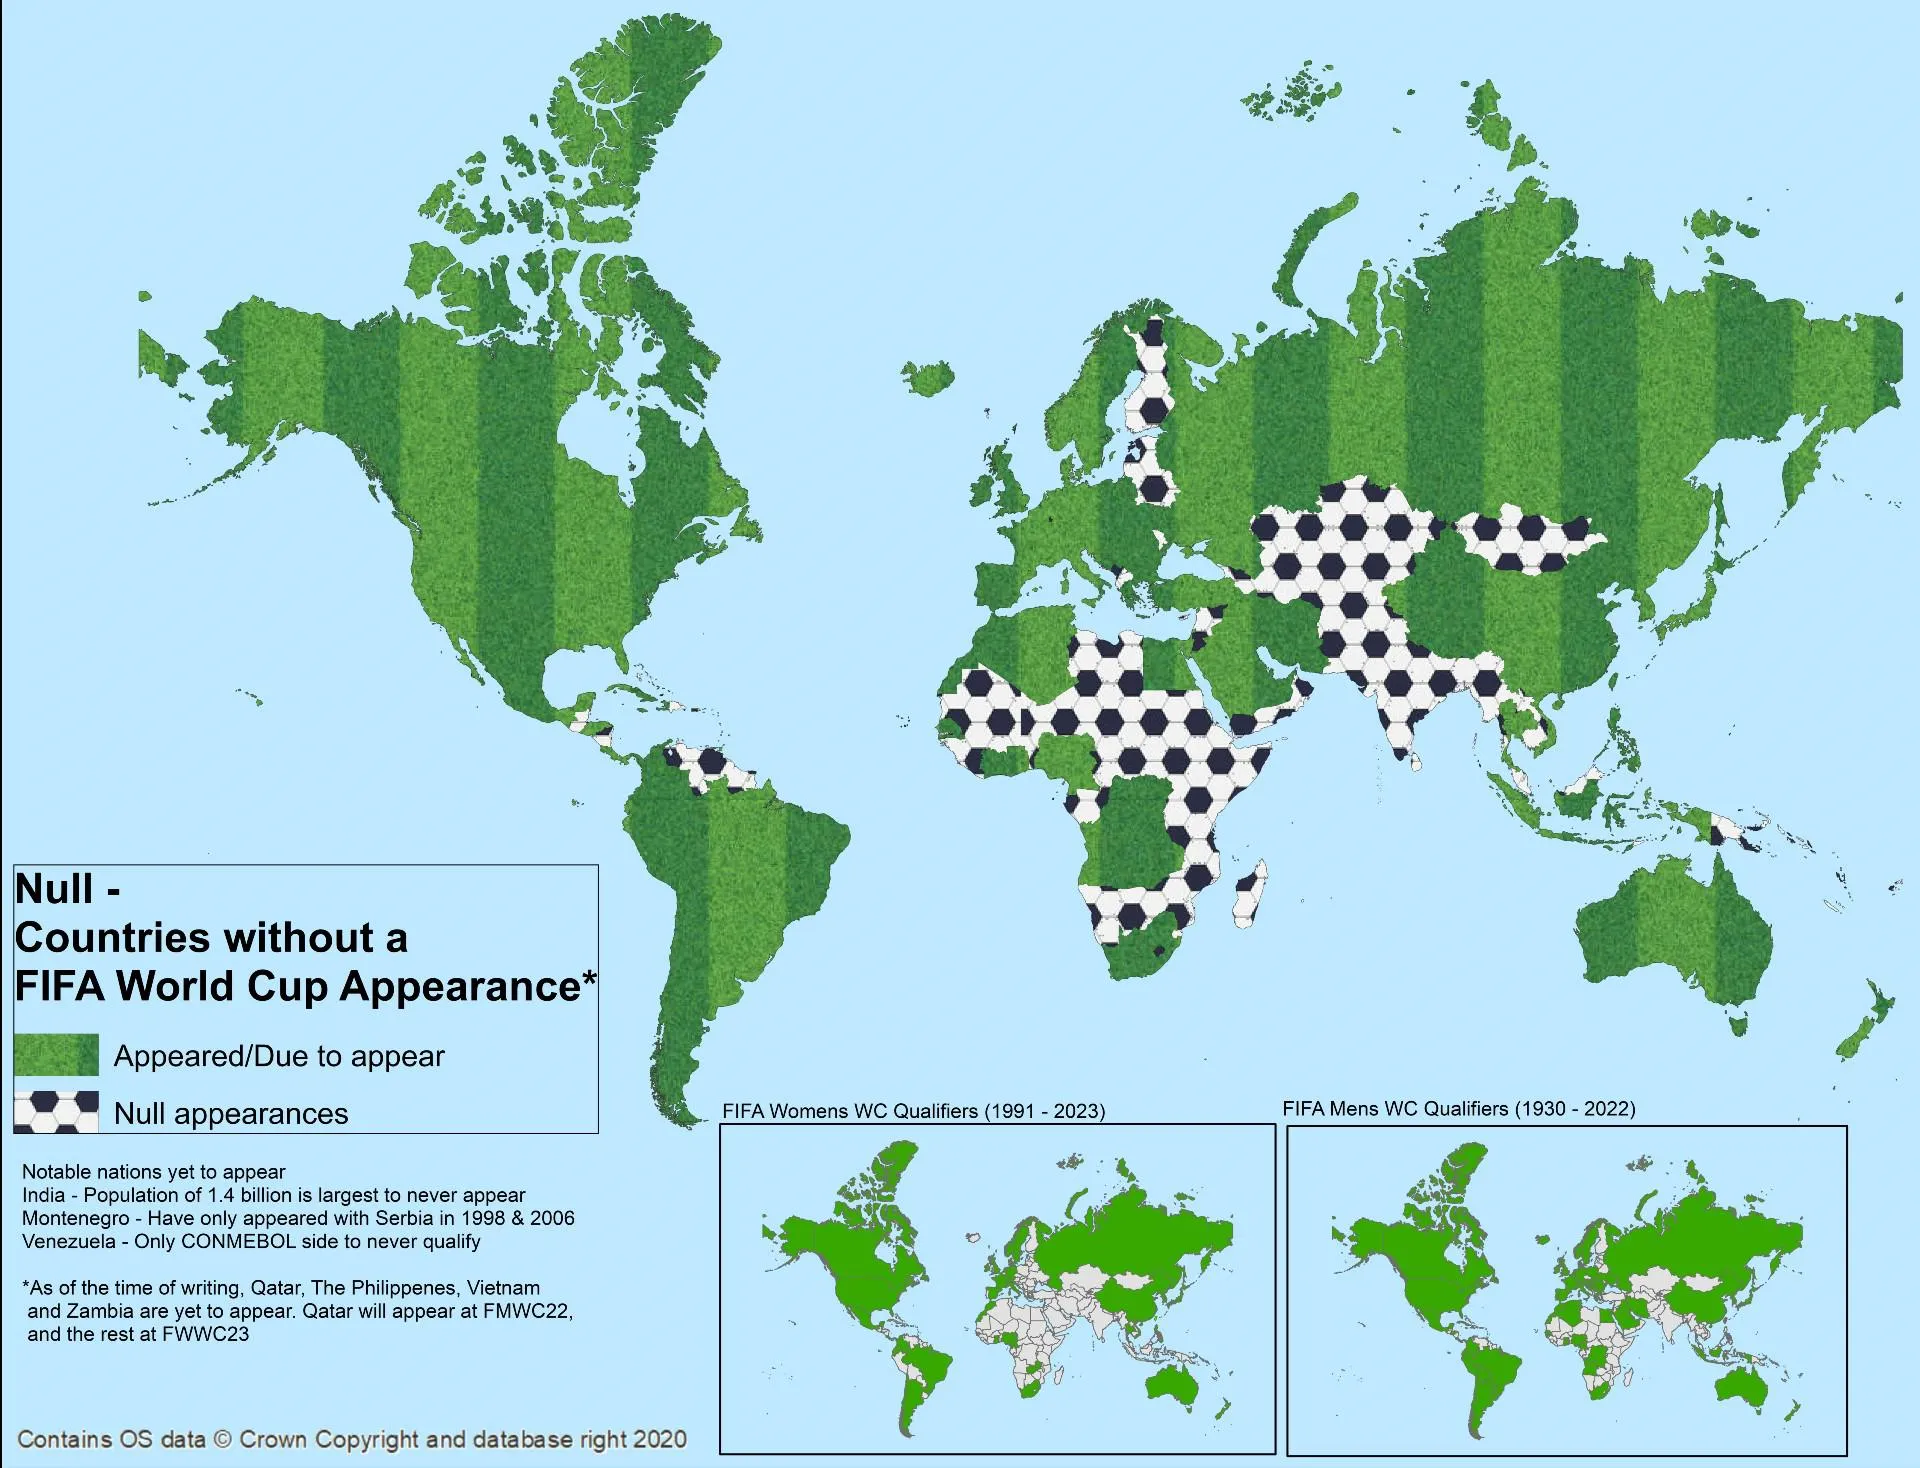
Countries without a FIFA World Cup Appearance, Doug Leno
With much attention on the 2022 FIFA Men’s World Cup and the tournament debut of Qatar, Doug decided to display the countries with ‘Null’ tournament qualifications. Many of these nations still have just as much passion for football as the rest of the world, but for various reasons have been ultimately unsuccessful in attempts to reach ‘the greatest tournament on Earth’. The unfortunate qualification history of some of these countries stretches all the way back to 1930.
In the history of the 31 Men's and Women's FIFA World Cups, 84 nations have been represented, including 23 sides with only a single appearance, six federations that no longer exist, and three sides waiting until the 2023 WWC for their debut.
72 teams have appeared at both a Men's and a Women's World Cup. Brazil are the only team to have qualified for every single Men (22) and Women's (9) tournament.
The United Kingdom is globally unique in that each of the home nations is allowed individual entry into FIFA tournaments. For the home nations boundaries, Doug used a simplified version of the OS admin boundary line, available through the OS data hub.
OS Data used – Boundary-Line
Day 23 - Movement
Seal a better place, Mel Marochov
This animation shows the movement of a grey seal in the North Sea throughout 2008 (white dot). Mel used the MovingPandas Python library to analyse the data and add average speed in metres per second, as represented by the coloured line following the seal. The data is from Movebank and is cited as the following:
McConnell BJ (2019) Data from: State-switching continuous-time correlated random walks. Movebank Data Repository. https://doi.org/10.5441/001/1.m7j2263r
These data are described in the following written publications:
Michelot T, Blackwell PG (2019) State-switching continuous-time correlated random walks. Methods in Ecology and Evolution. https://doi.org/10.1111/2041-210X.13154
OS Data used – N/A
Day 24 – Fantasy
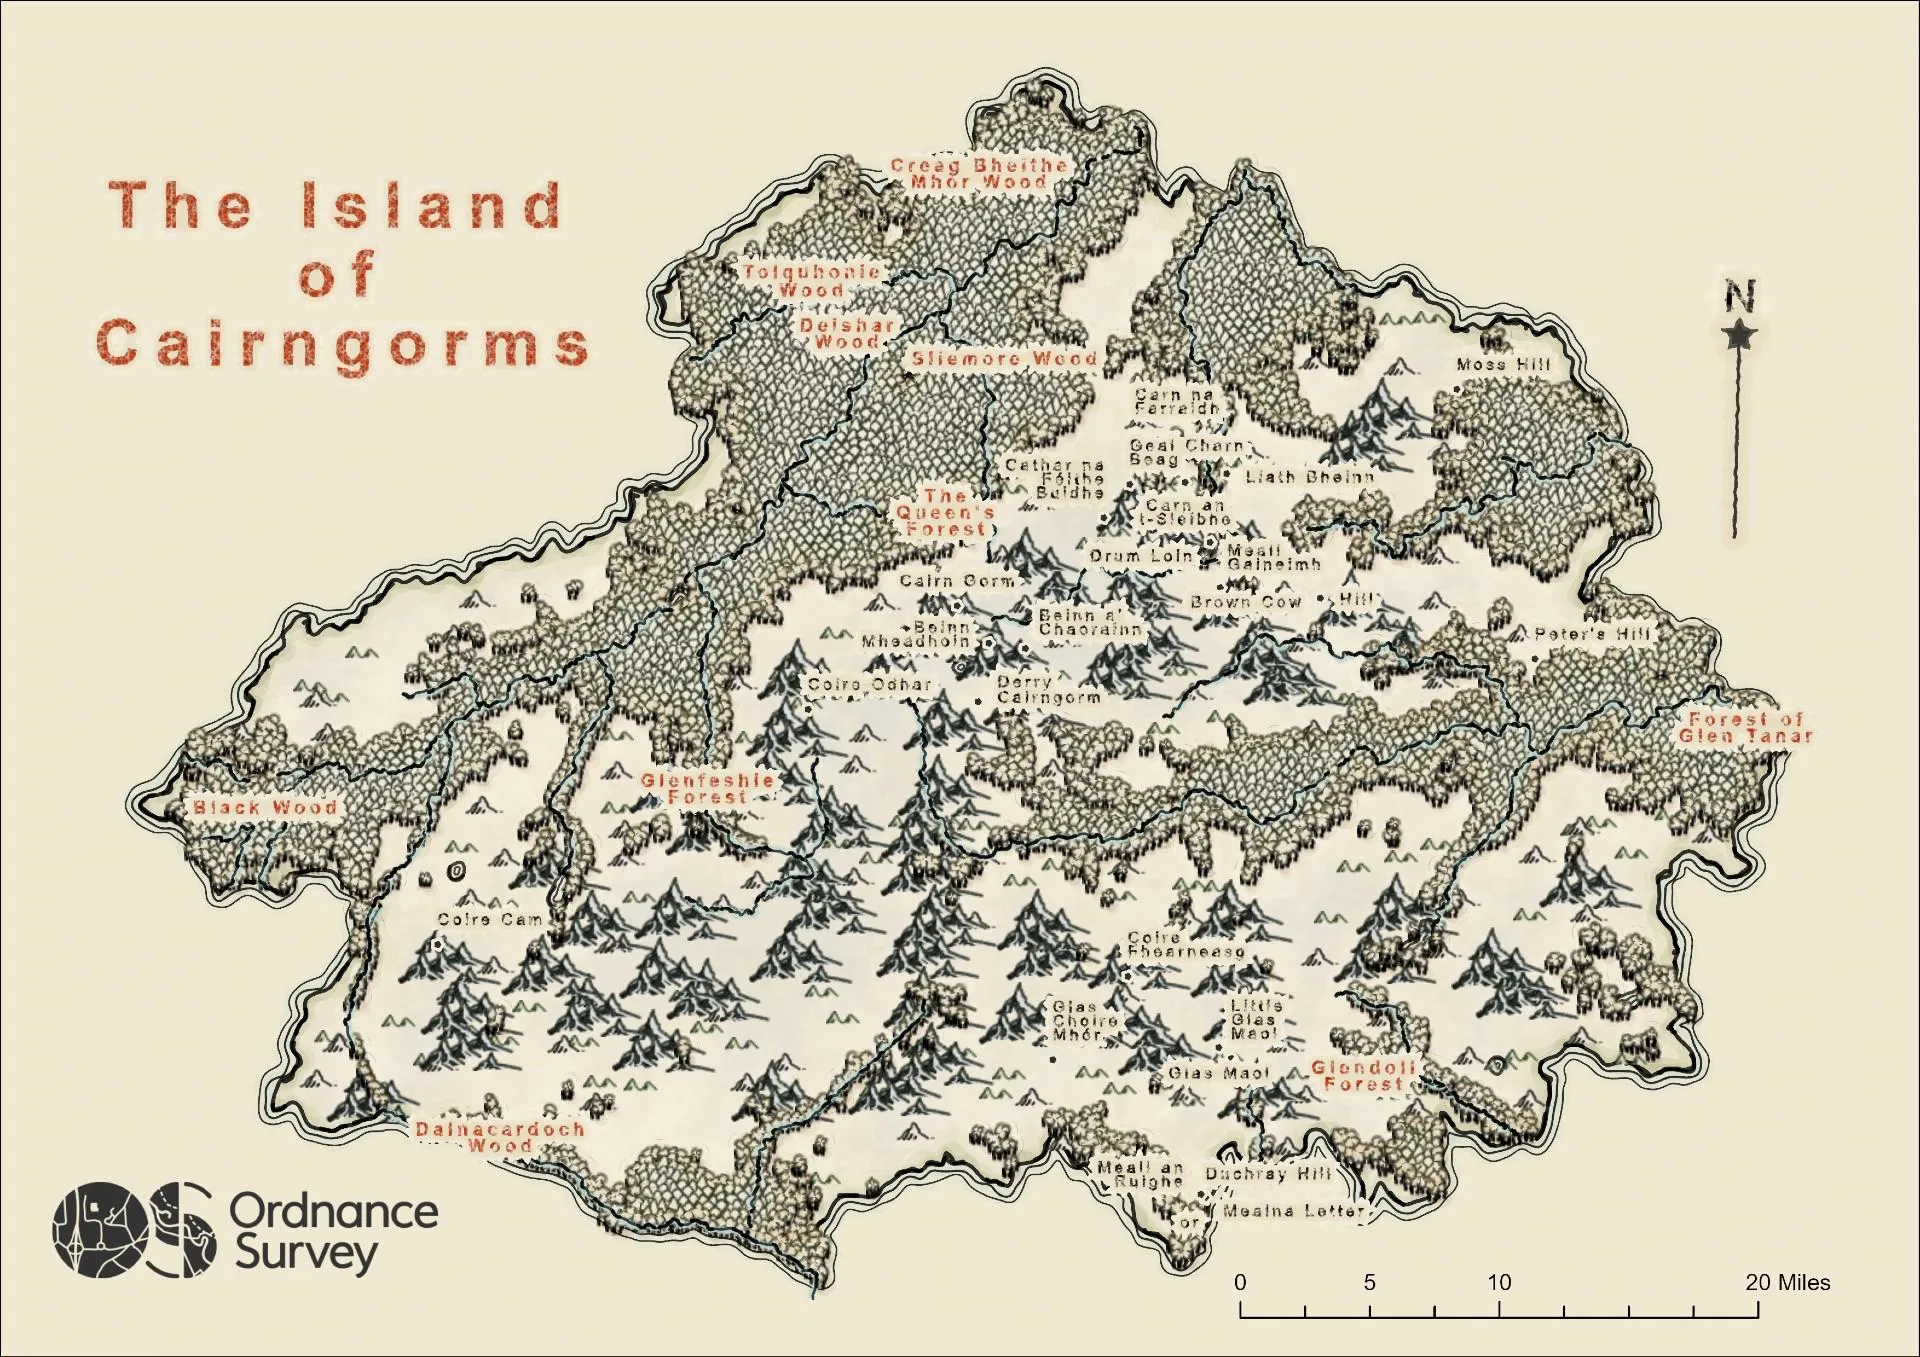
The Island of Cairngorms, Brian Johnston
Welcome to the mystical Island of Cairngorms.
Brian, the creator of this map, has made a fantasy island using OS data within the extent of the Cairngorms National Park and applying @John_M_Nelson's 'My Precious' Style.
Now we've a world map for level 1 nobodies or our level 20 champions. Hopefully we won't get a TPK...
OS Data used – OS Open Zoomstack
Day 25 – Colour Friday: 2 colours
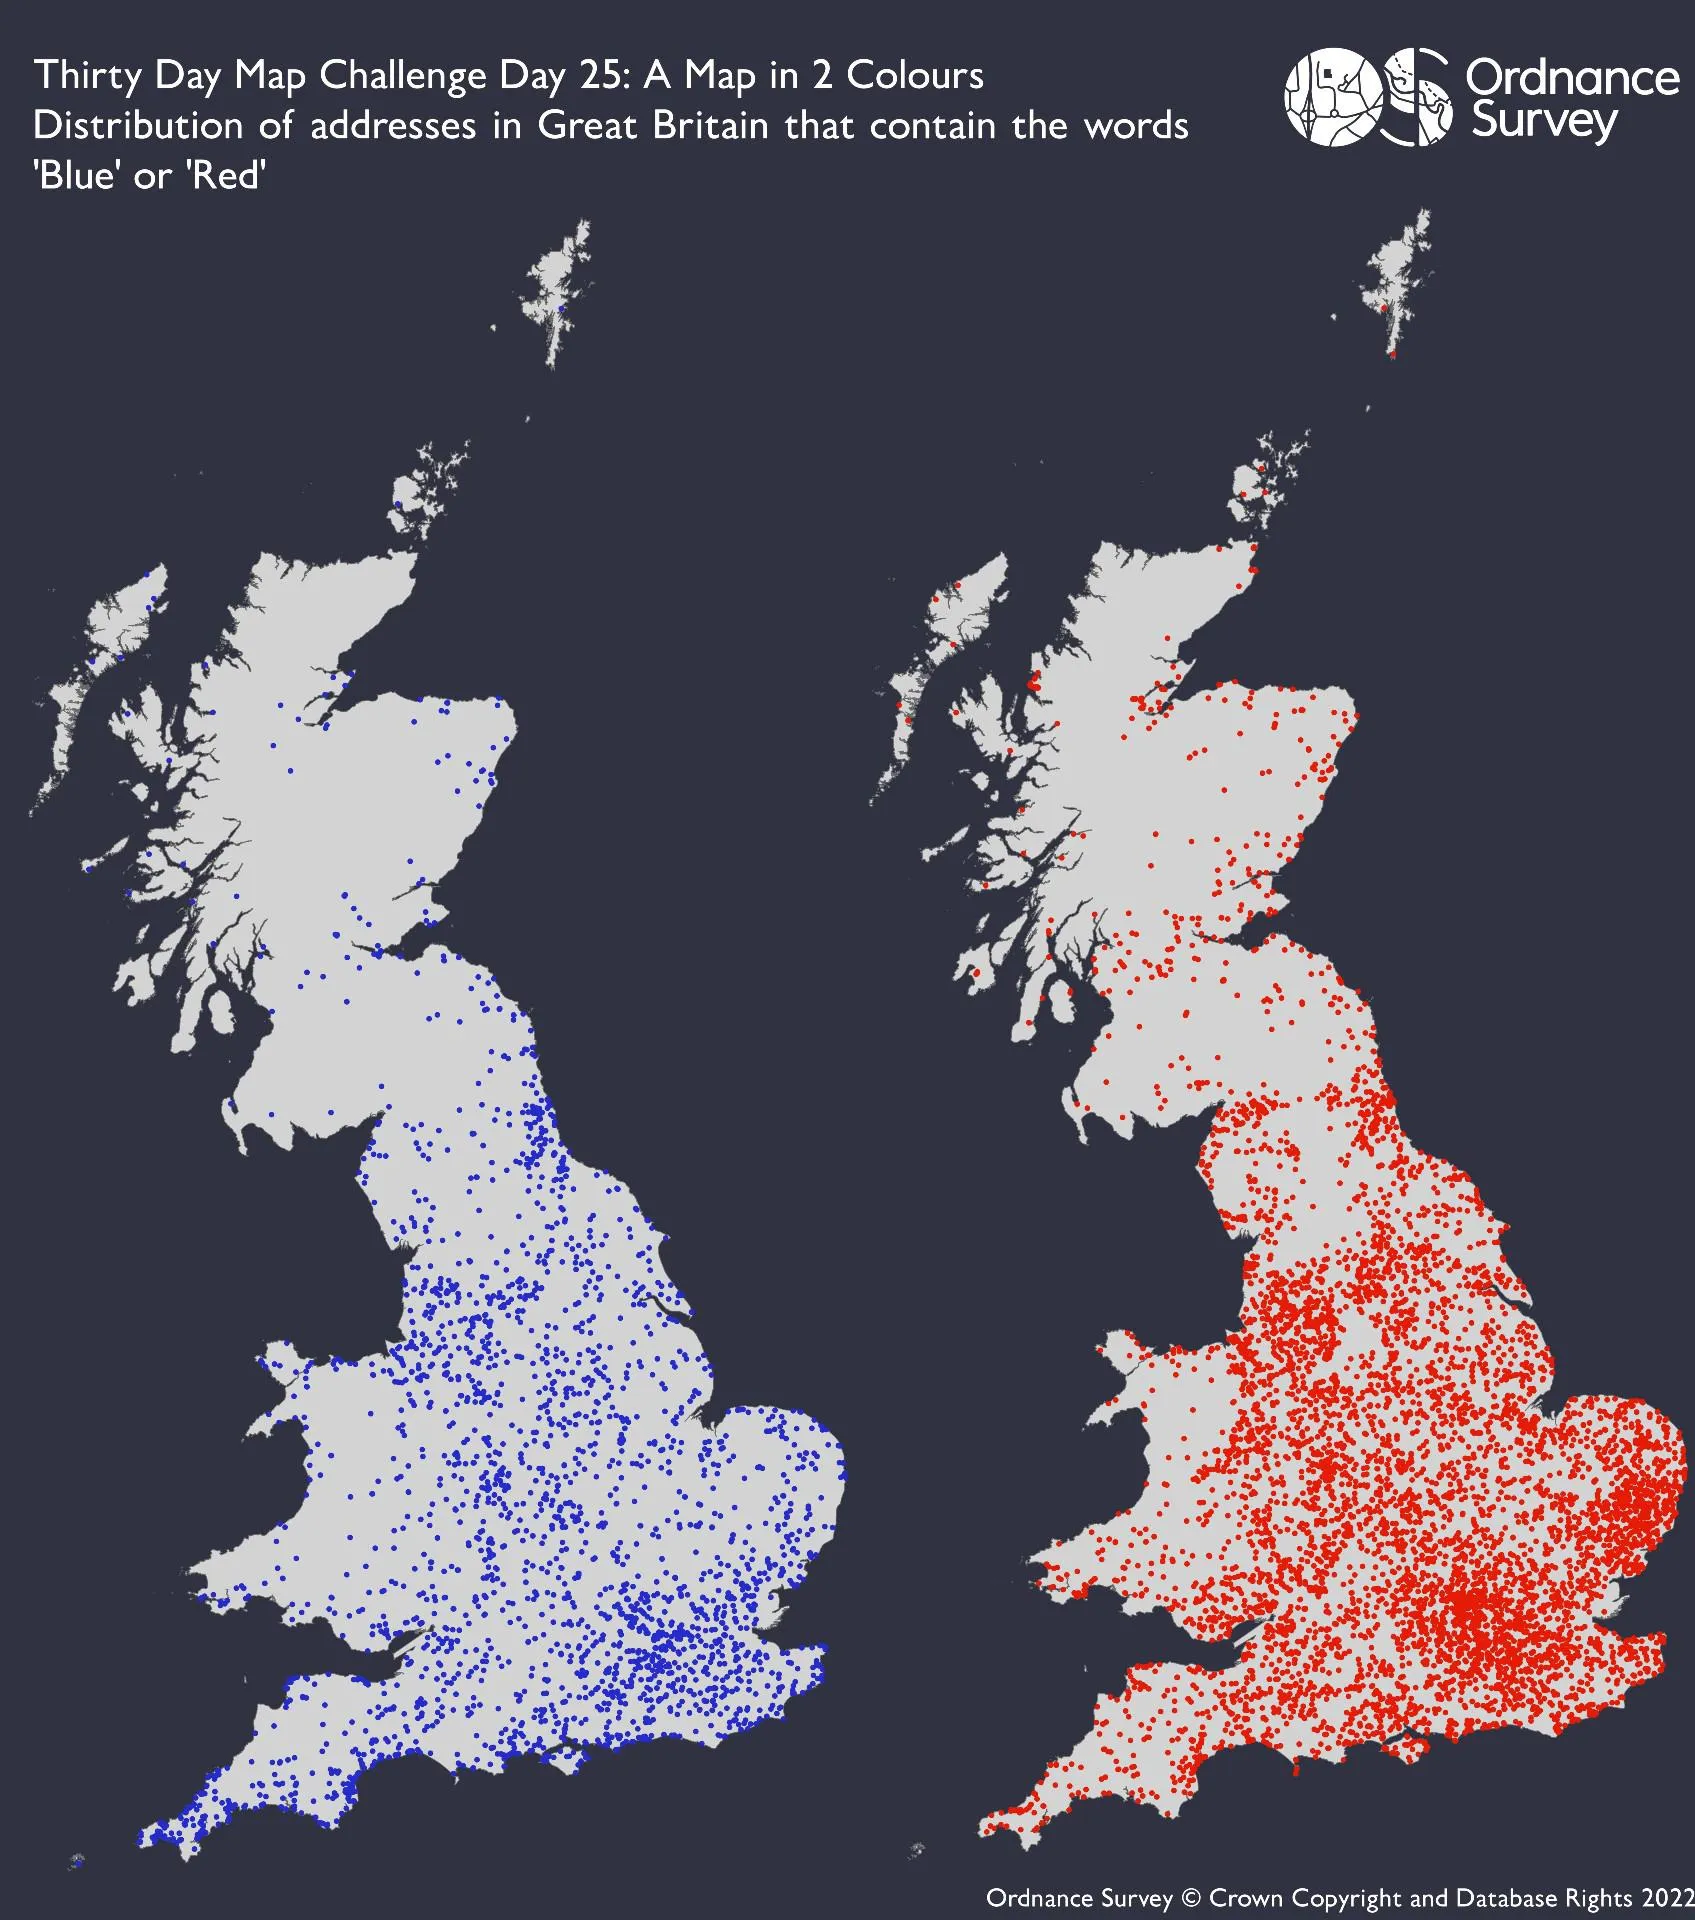
A Map in 2 colours, Sadie Harriott
This map shows the distribution of addresses in Great Britain with the words ‘Blue’ or ‘Red’ in the name of the property. There are approx. 14,500 ‘Red’ addresses, and 6,100 Blue addresses.
OS Data used – OS Open Zoomstack, AddressBase Plus
Day 26 – Island(s) (we had 3 entries for this day)
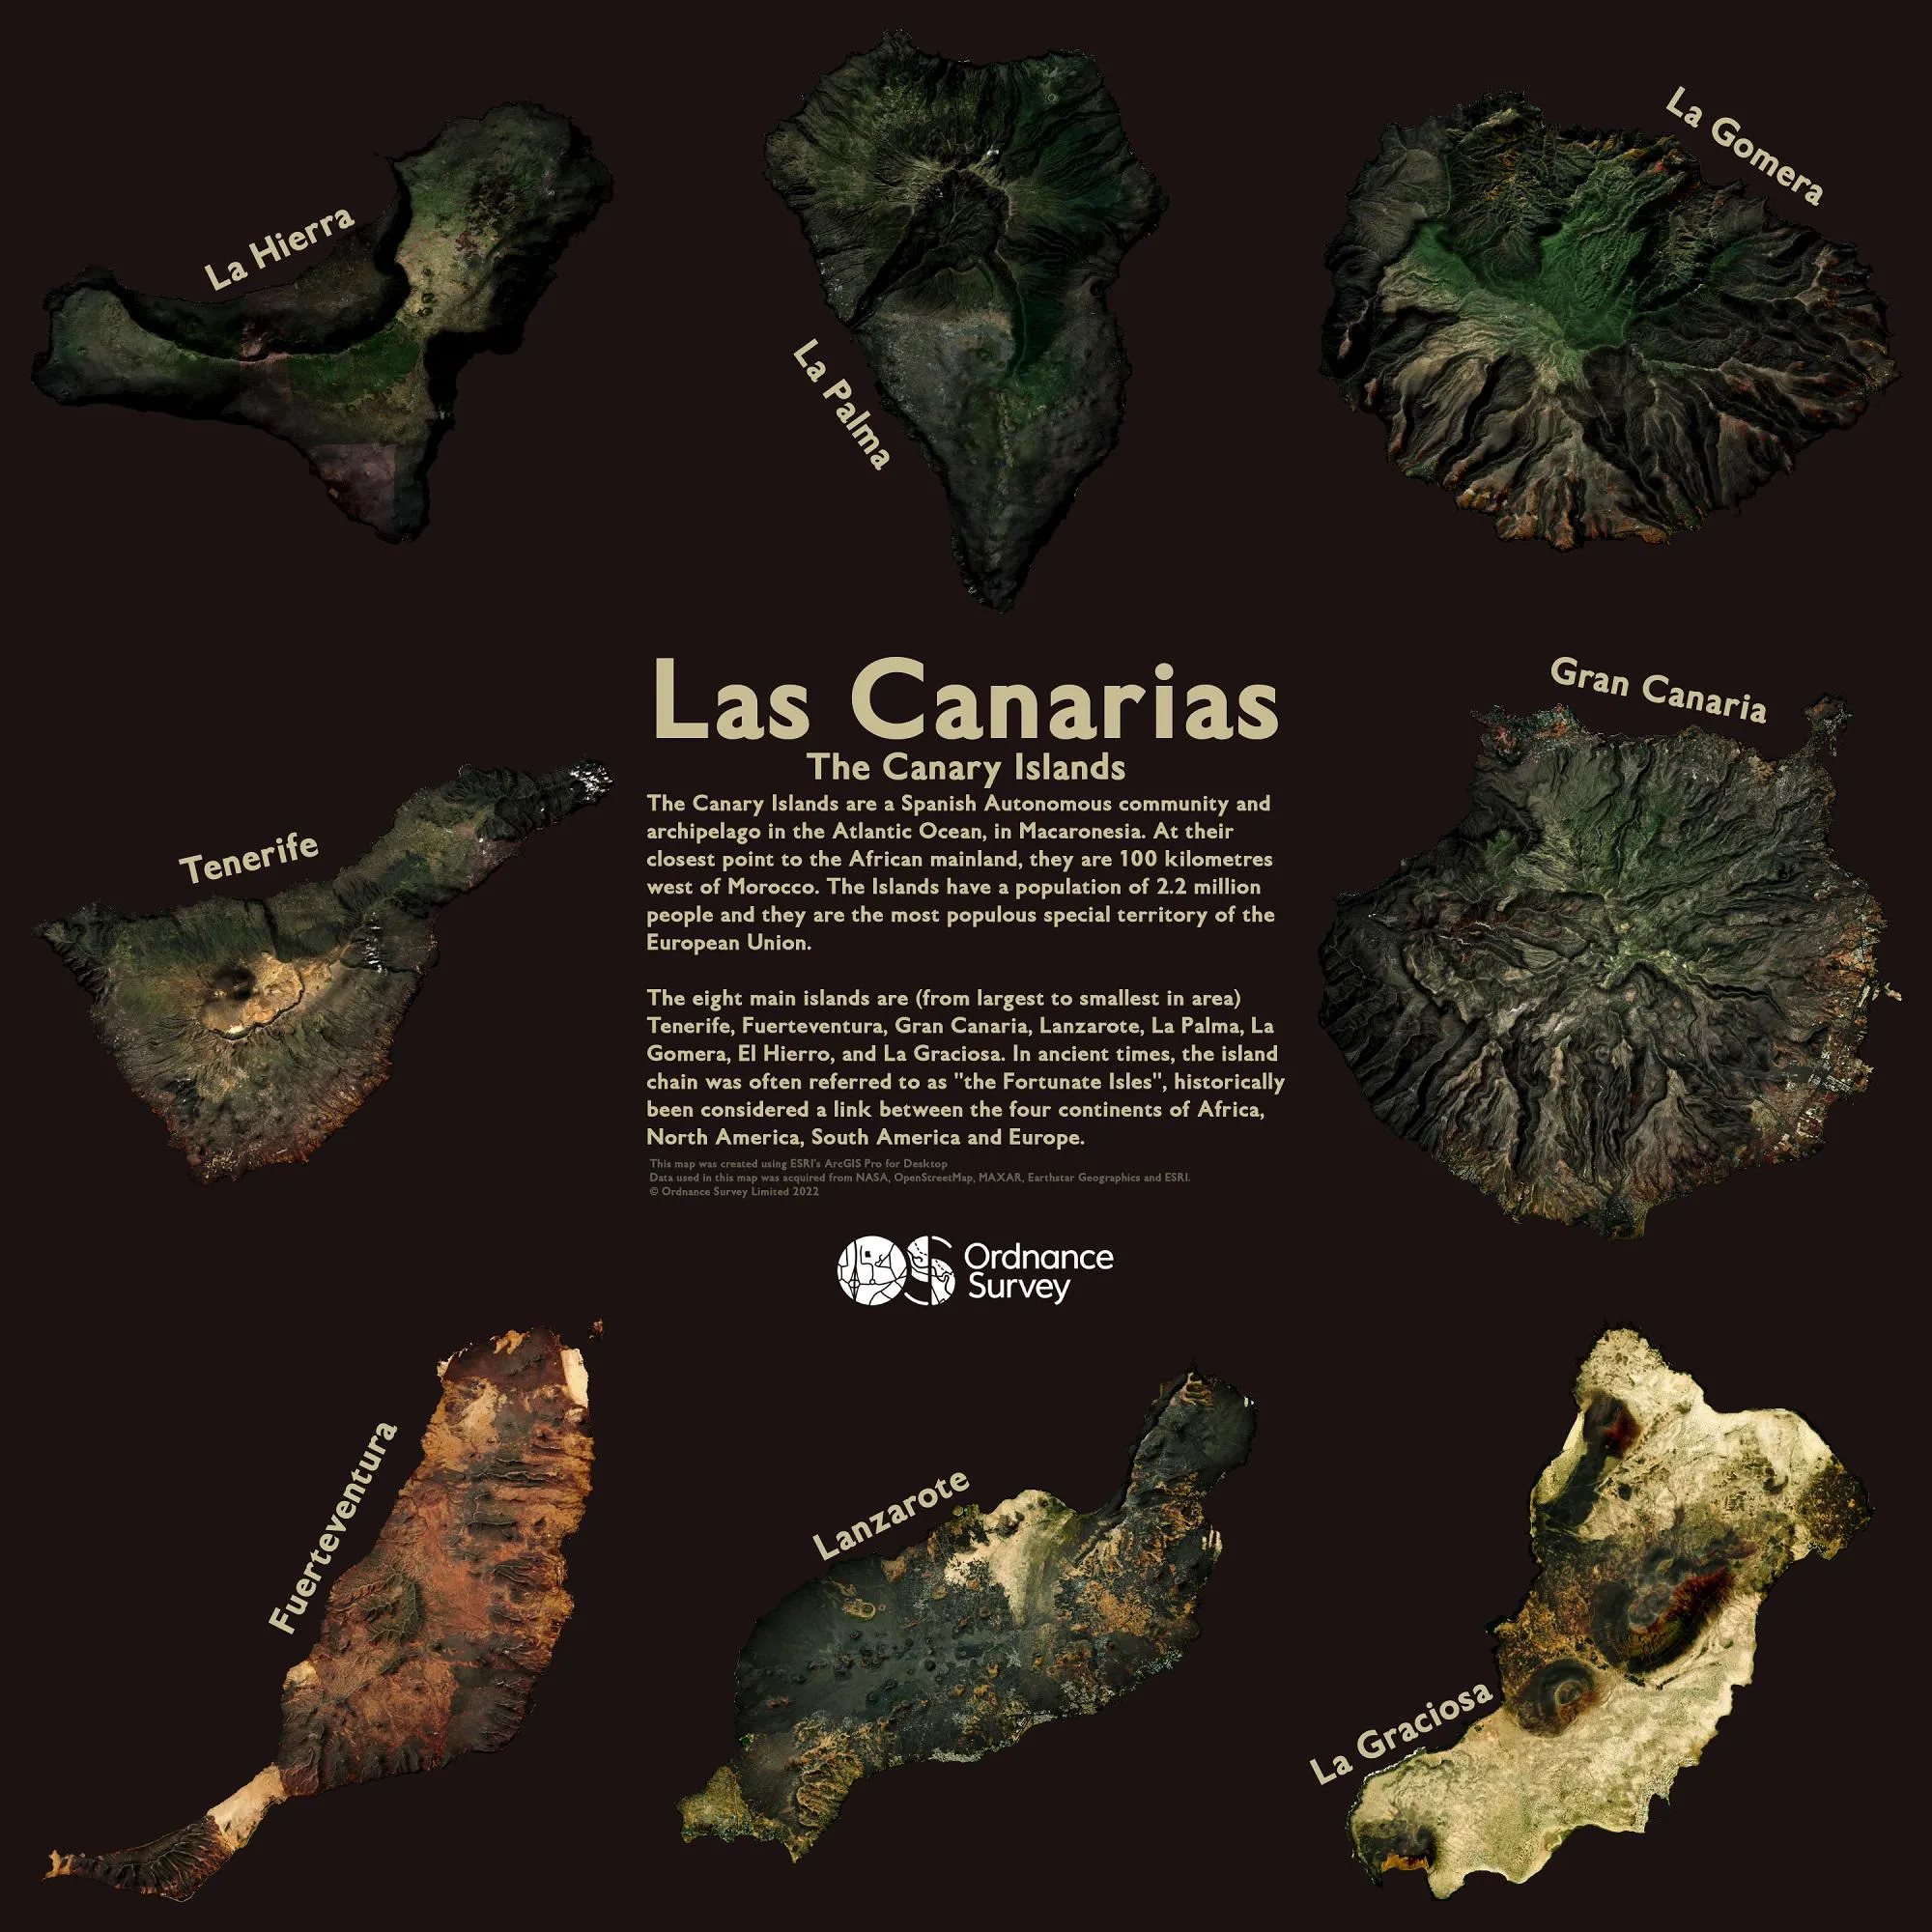
Las Canarias – The Canary Islands, Myles Colling
An abstract map showing exaggerated hillshade and topography of the 8 main islands within the Canarian Archipelago.
OS Data used – N/A
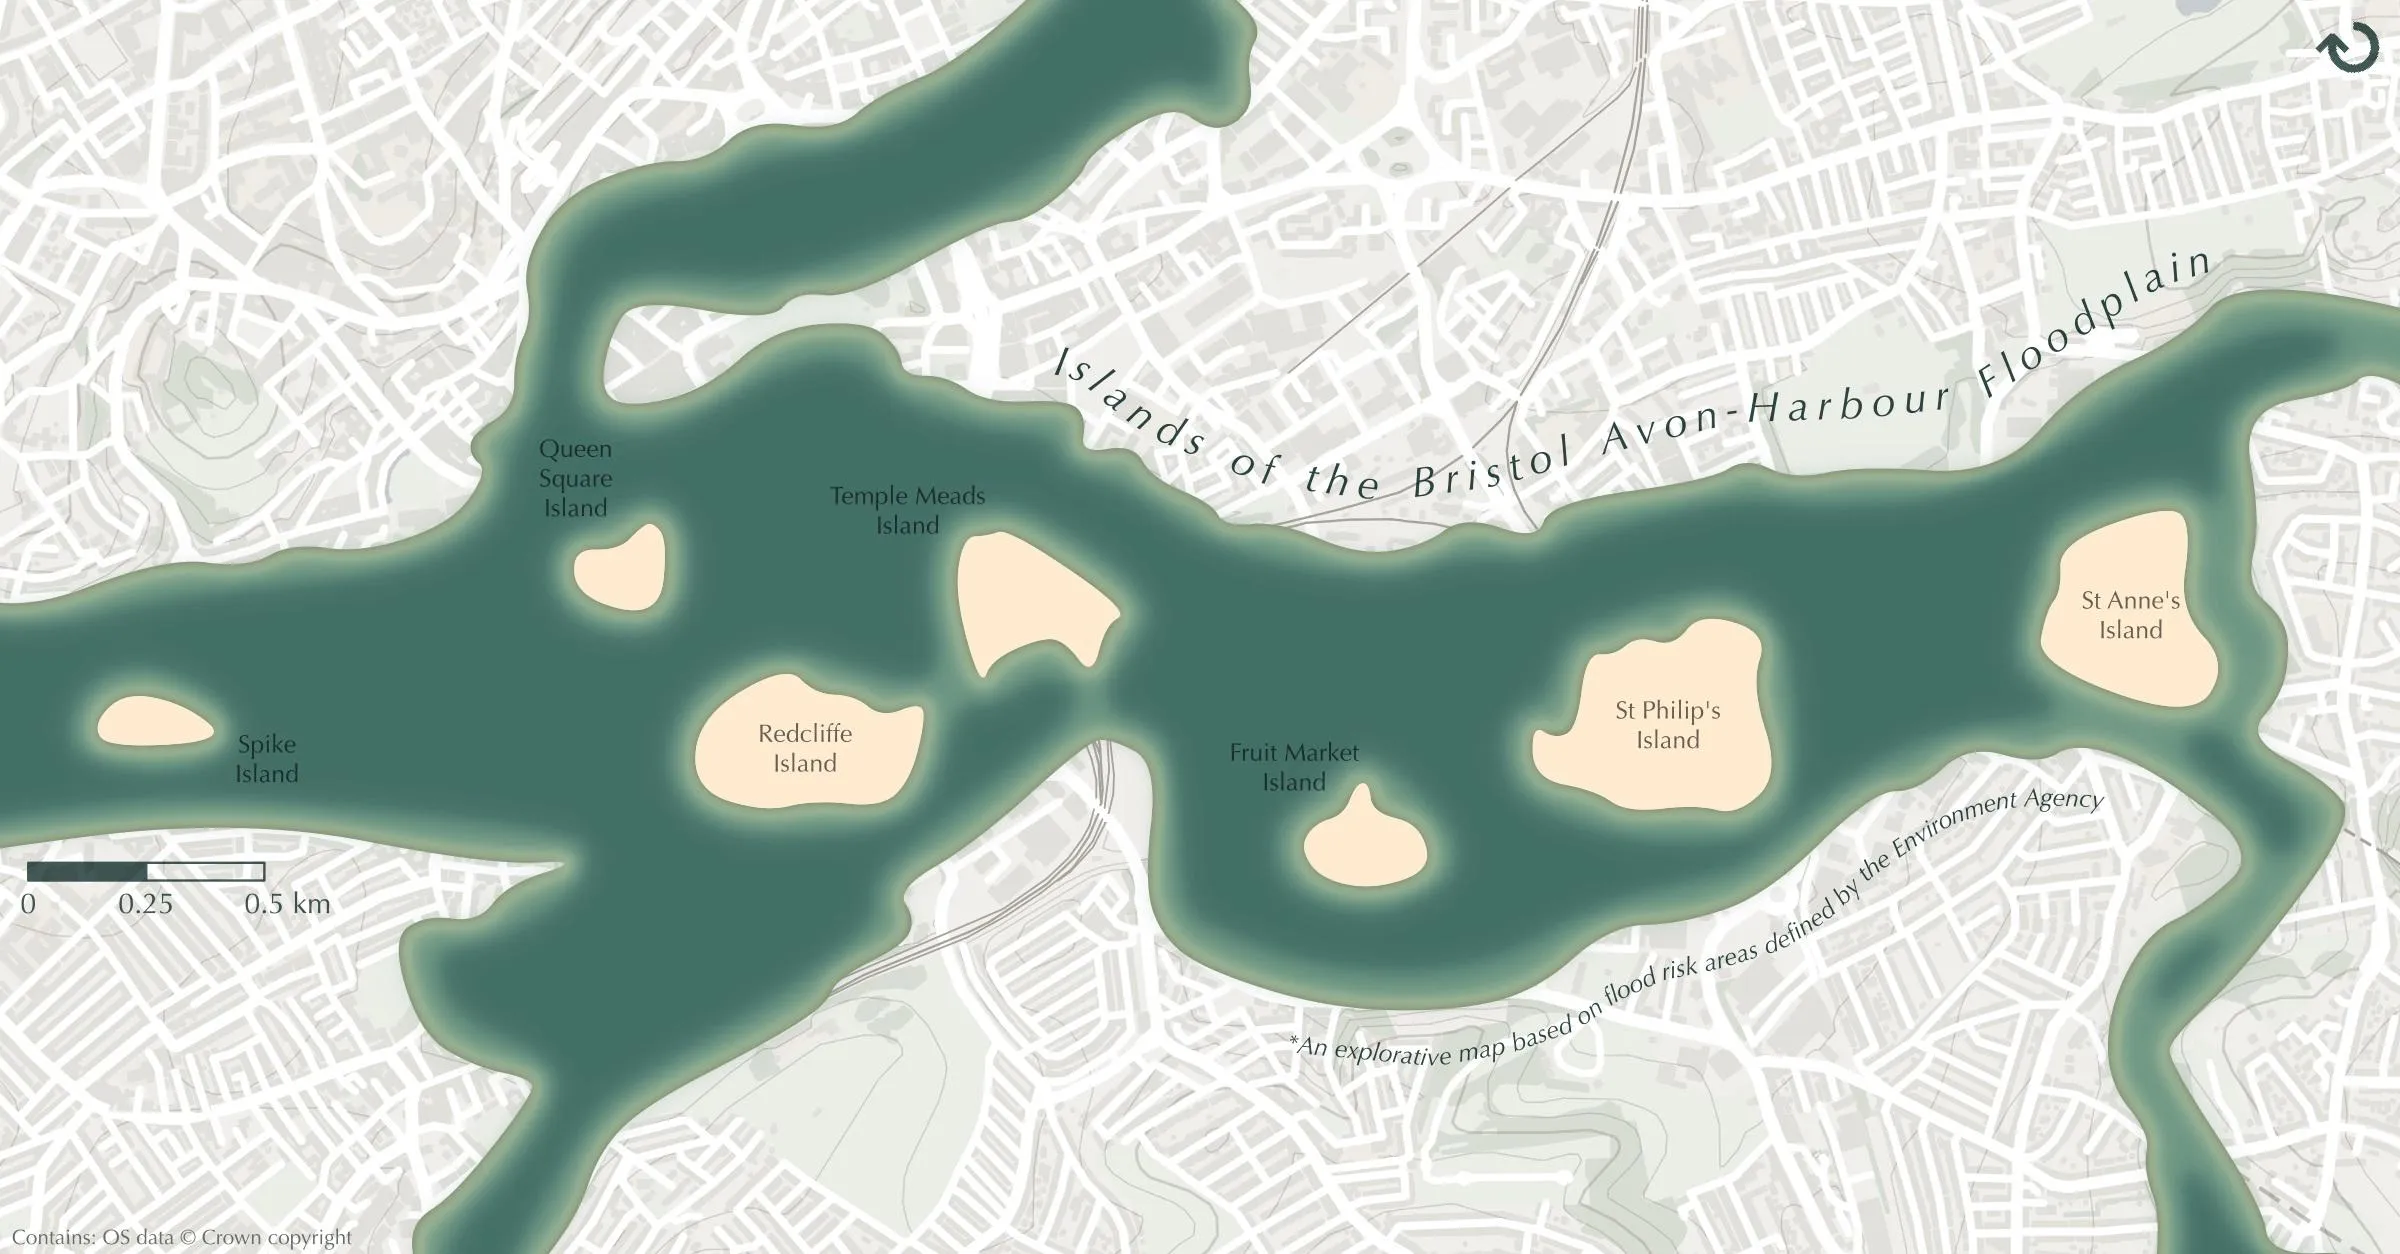
Islands of the Bristol Avon-Harbour floodplain, Richard Hargreaves
The seven islands of the Bristol Avon-Harbour floodplain. Given the scenario of full flooding in Environment Agency flood risk areas, how would the City of #Bristol change?
This map represents what that future could look like.
OS Data used – OS Open Zoomstack
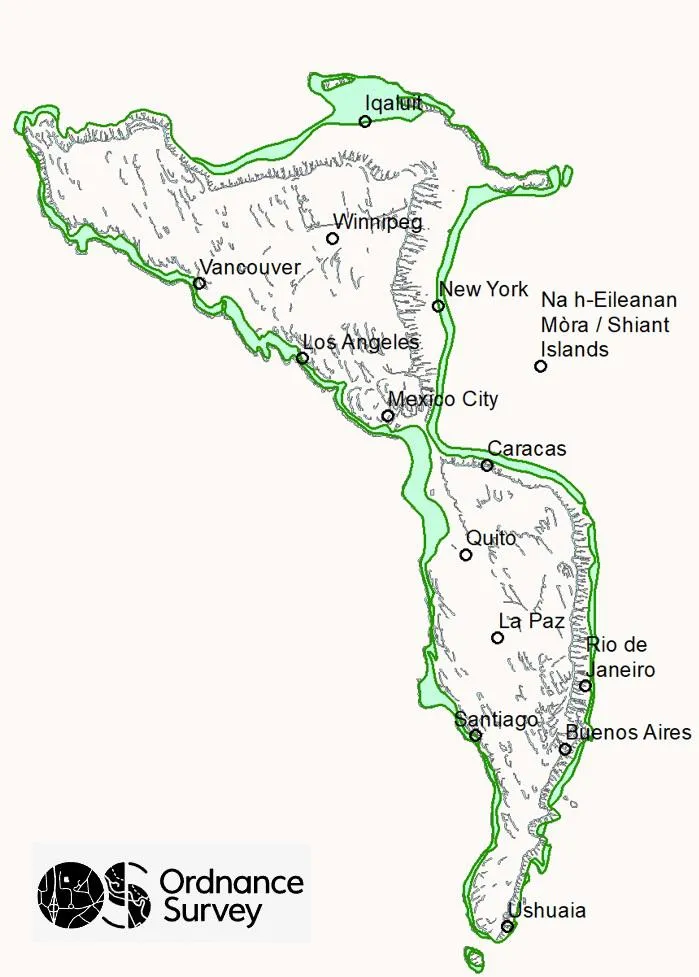
Shiant Be Going to America, Sean Kennedy
A whimsical allusion to the Shiant Islands' uncanny resemblance to North and South America - complete with isthmus between the two largest "islands". For those who don't know, the Shiant Islands lie in the Little Minch between Lewis and Skye. Sean, the creator of this map, says that any shortcomings in the positioning of cities in the Americas is excused by (i) this isn't really a map of America, so of course their locations can't be perfect; and (ii) I'm much more familiar with domestic geography!
OS Data used – OS VectorMap District
Day 27 – Music
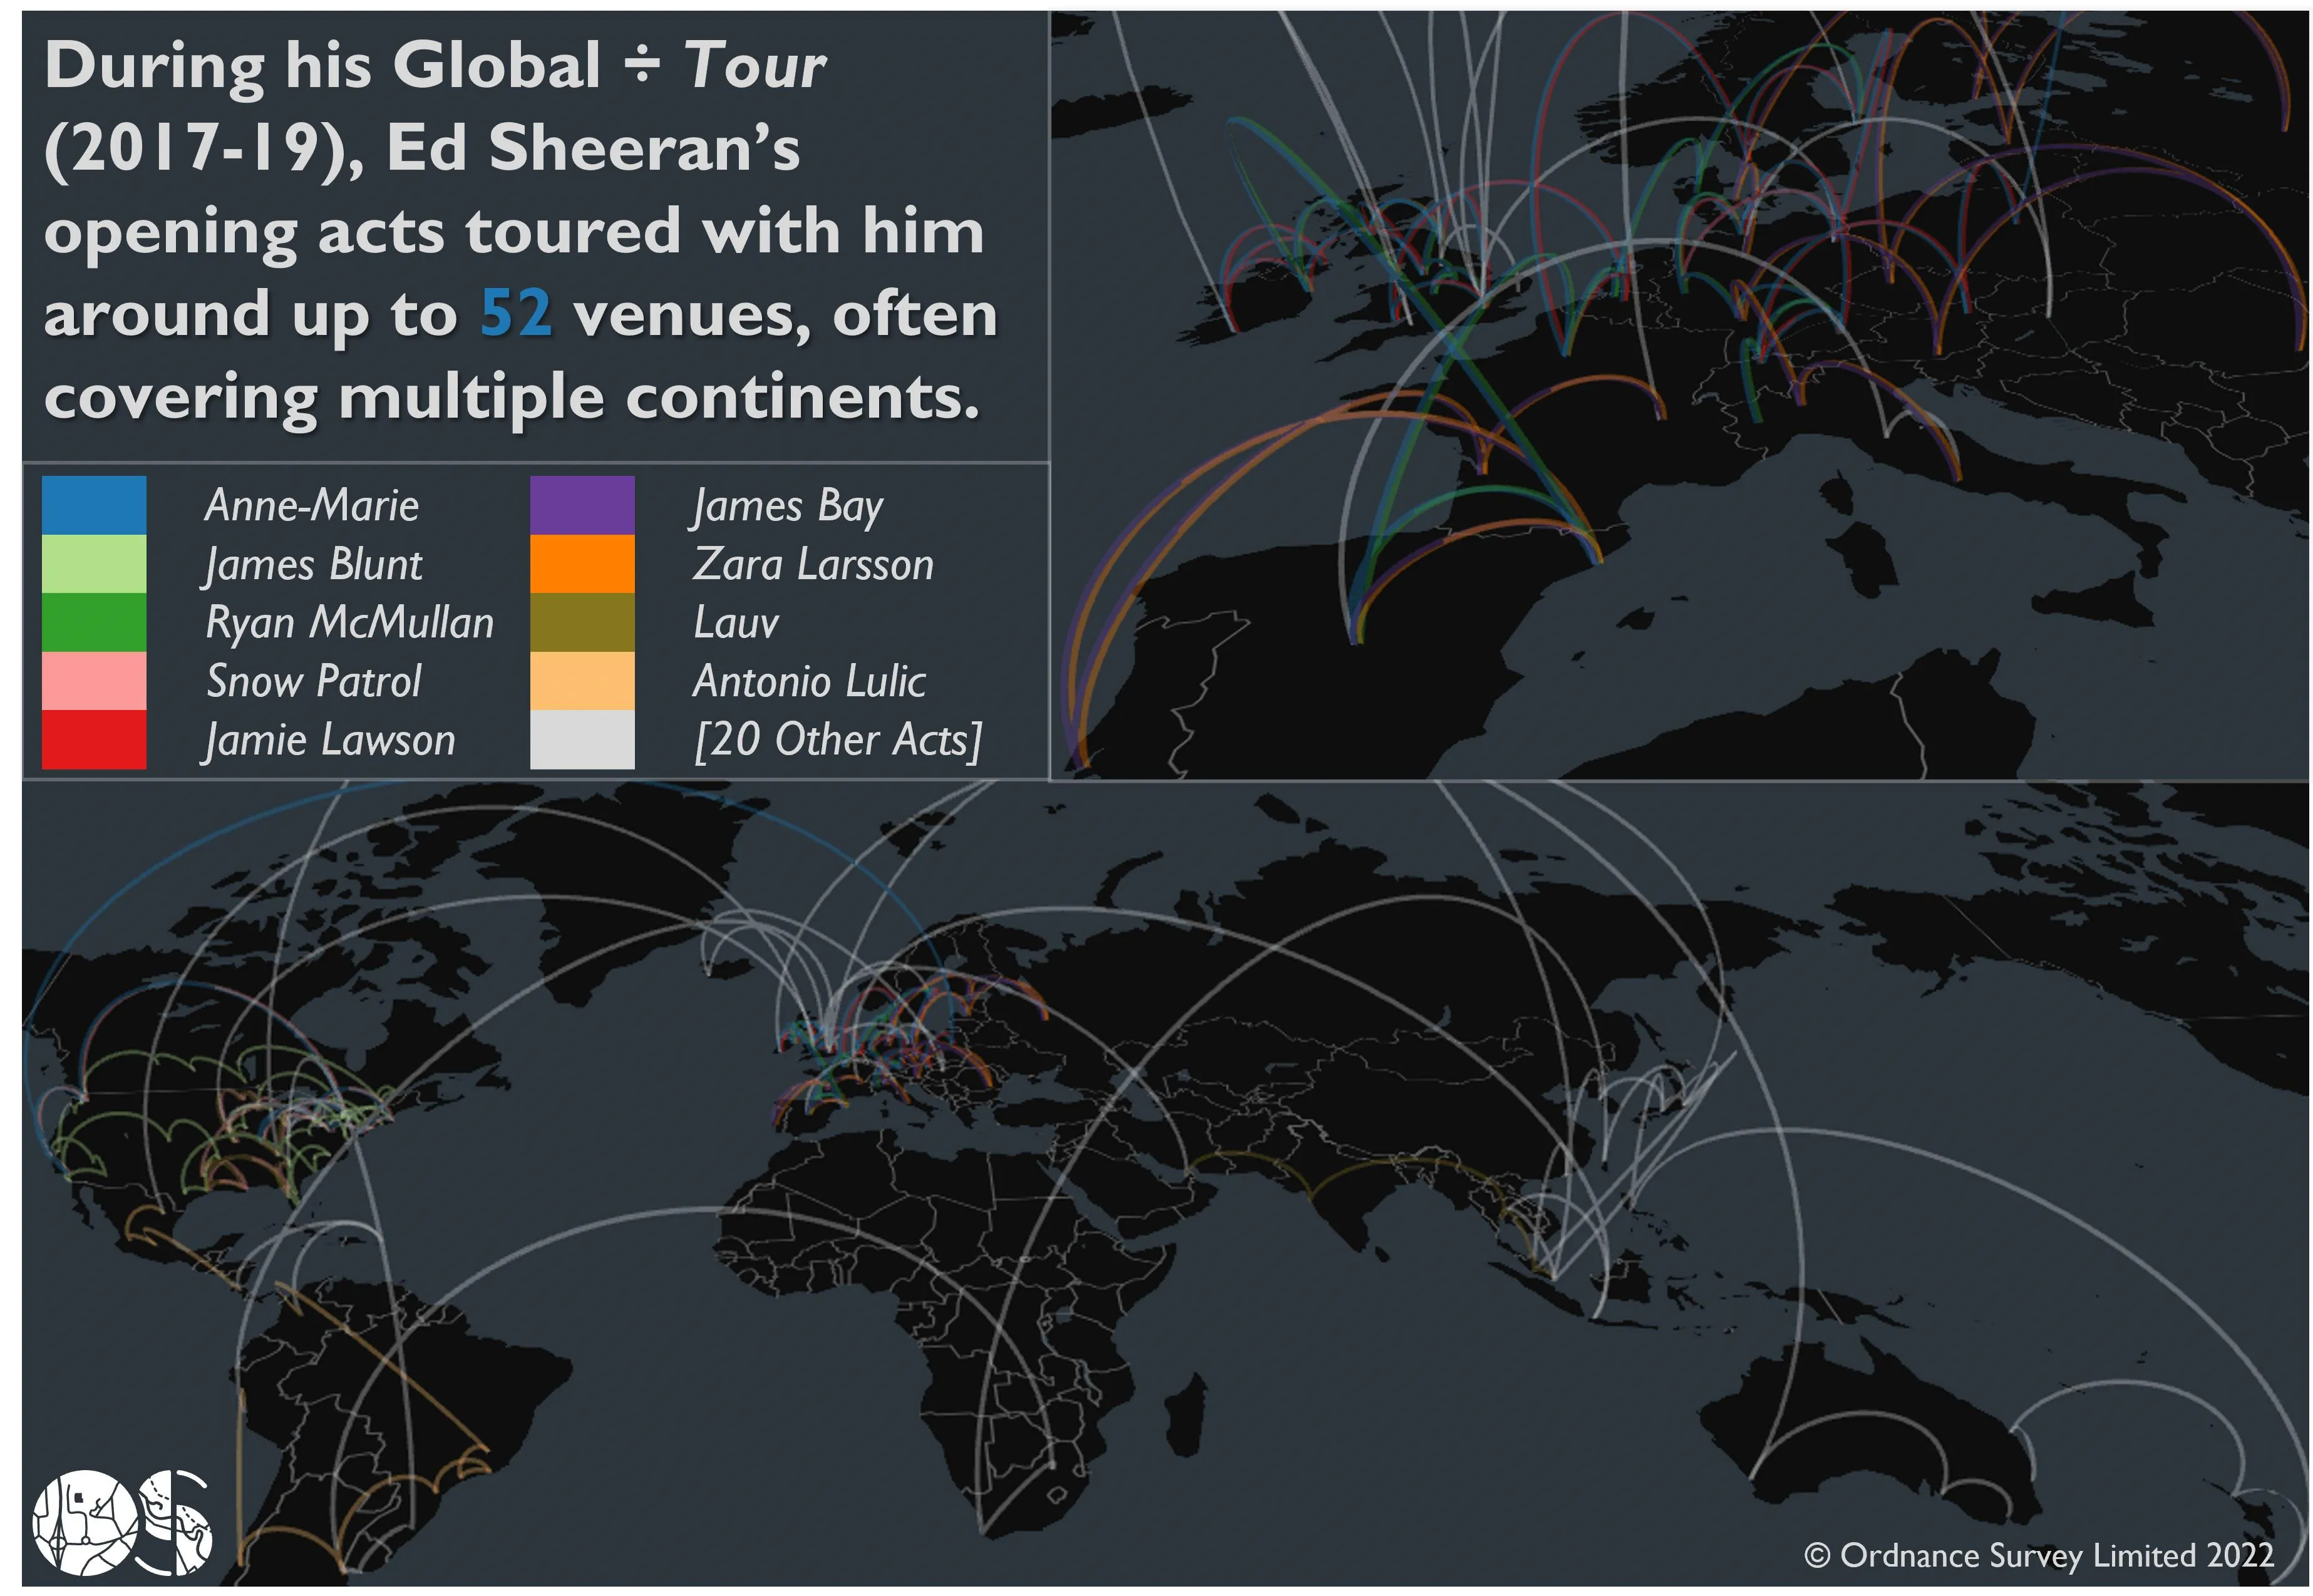
÷ Tour Map, Murray Chapman
A plot of Ed Sheeran's two-year global 'Divide Tour', coloured according to the opening acts which accompanied him for chunks of the tour.
Data sourced from https://en.wikipedia.org/wiki/%C3%B7_Tour
Wranged and visualised using python, and visualised using python's pydeck library, powered by deck.gl. Basemap from CARTO.
OS Data used – N/A
Day 28 – 3D
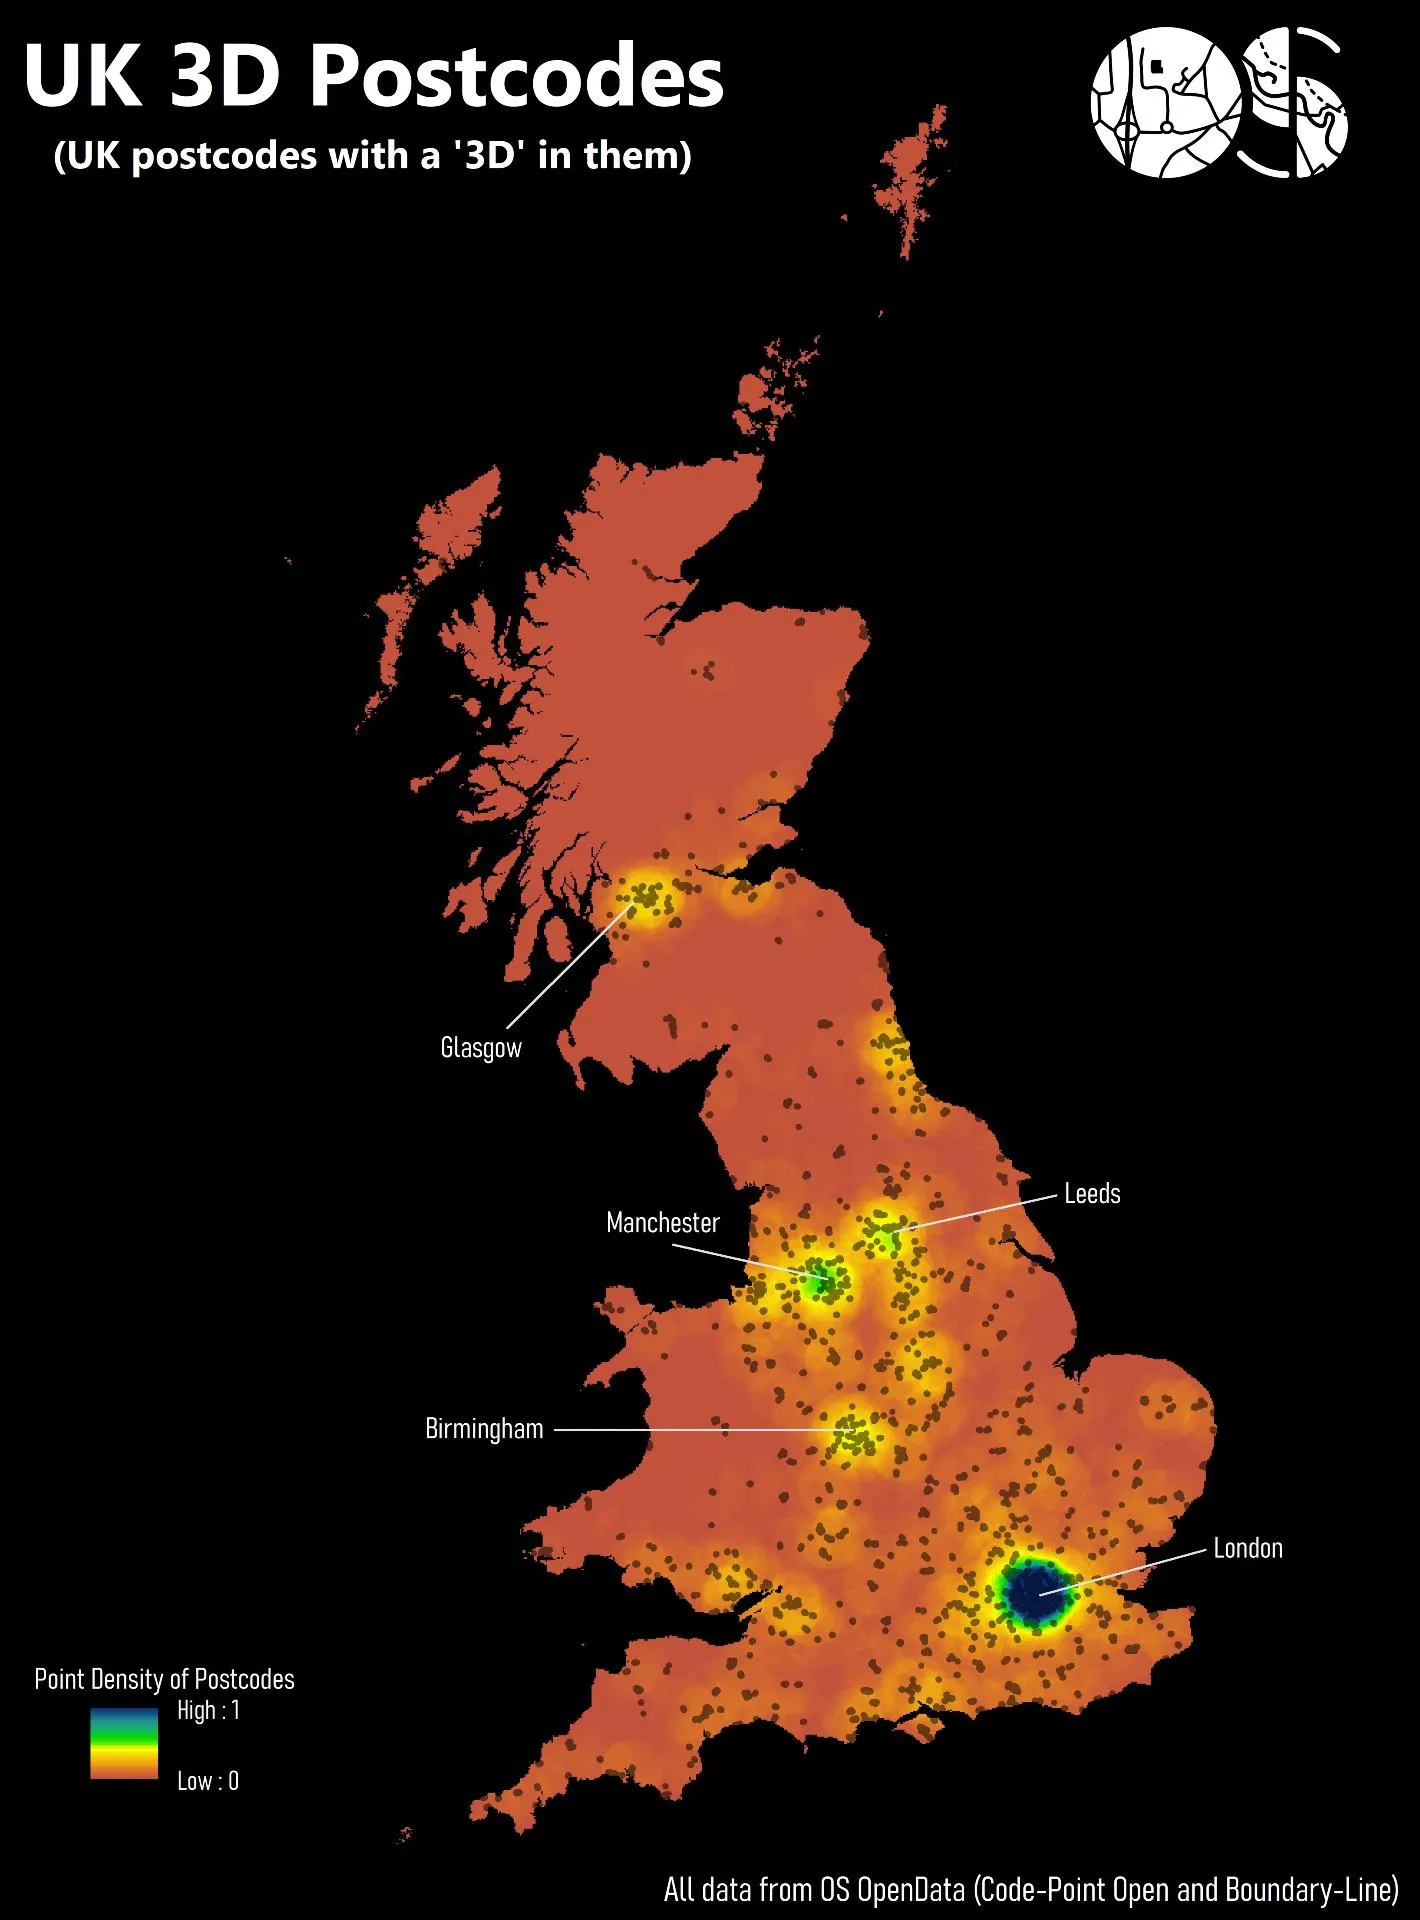
UK 3D Postcodes, Anna Labetski
Instead of cheesy 3D maps this is a cheeky map about the density of postcodes with a 3D in them in the UK. The map was made with ArcMap 10.3.1 and Adobe Photoshop, and postcodes were filtered for only postcodes with a ‘3D’ in them. A point density raster was derived from the filtered post codes and a raster mask was applied with the boundaries of the UK. Points were left on top but with a slight transparency. The largest clusters are identified with lines with the location name. Most importantly it's made with all Open Data.
OS Data used – Code-Point Open, Boundary-Line
Day 29 – “Out of my comfort zone”
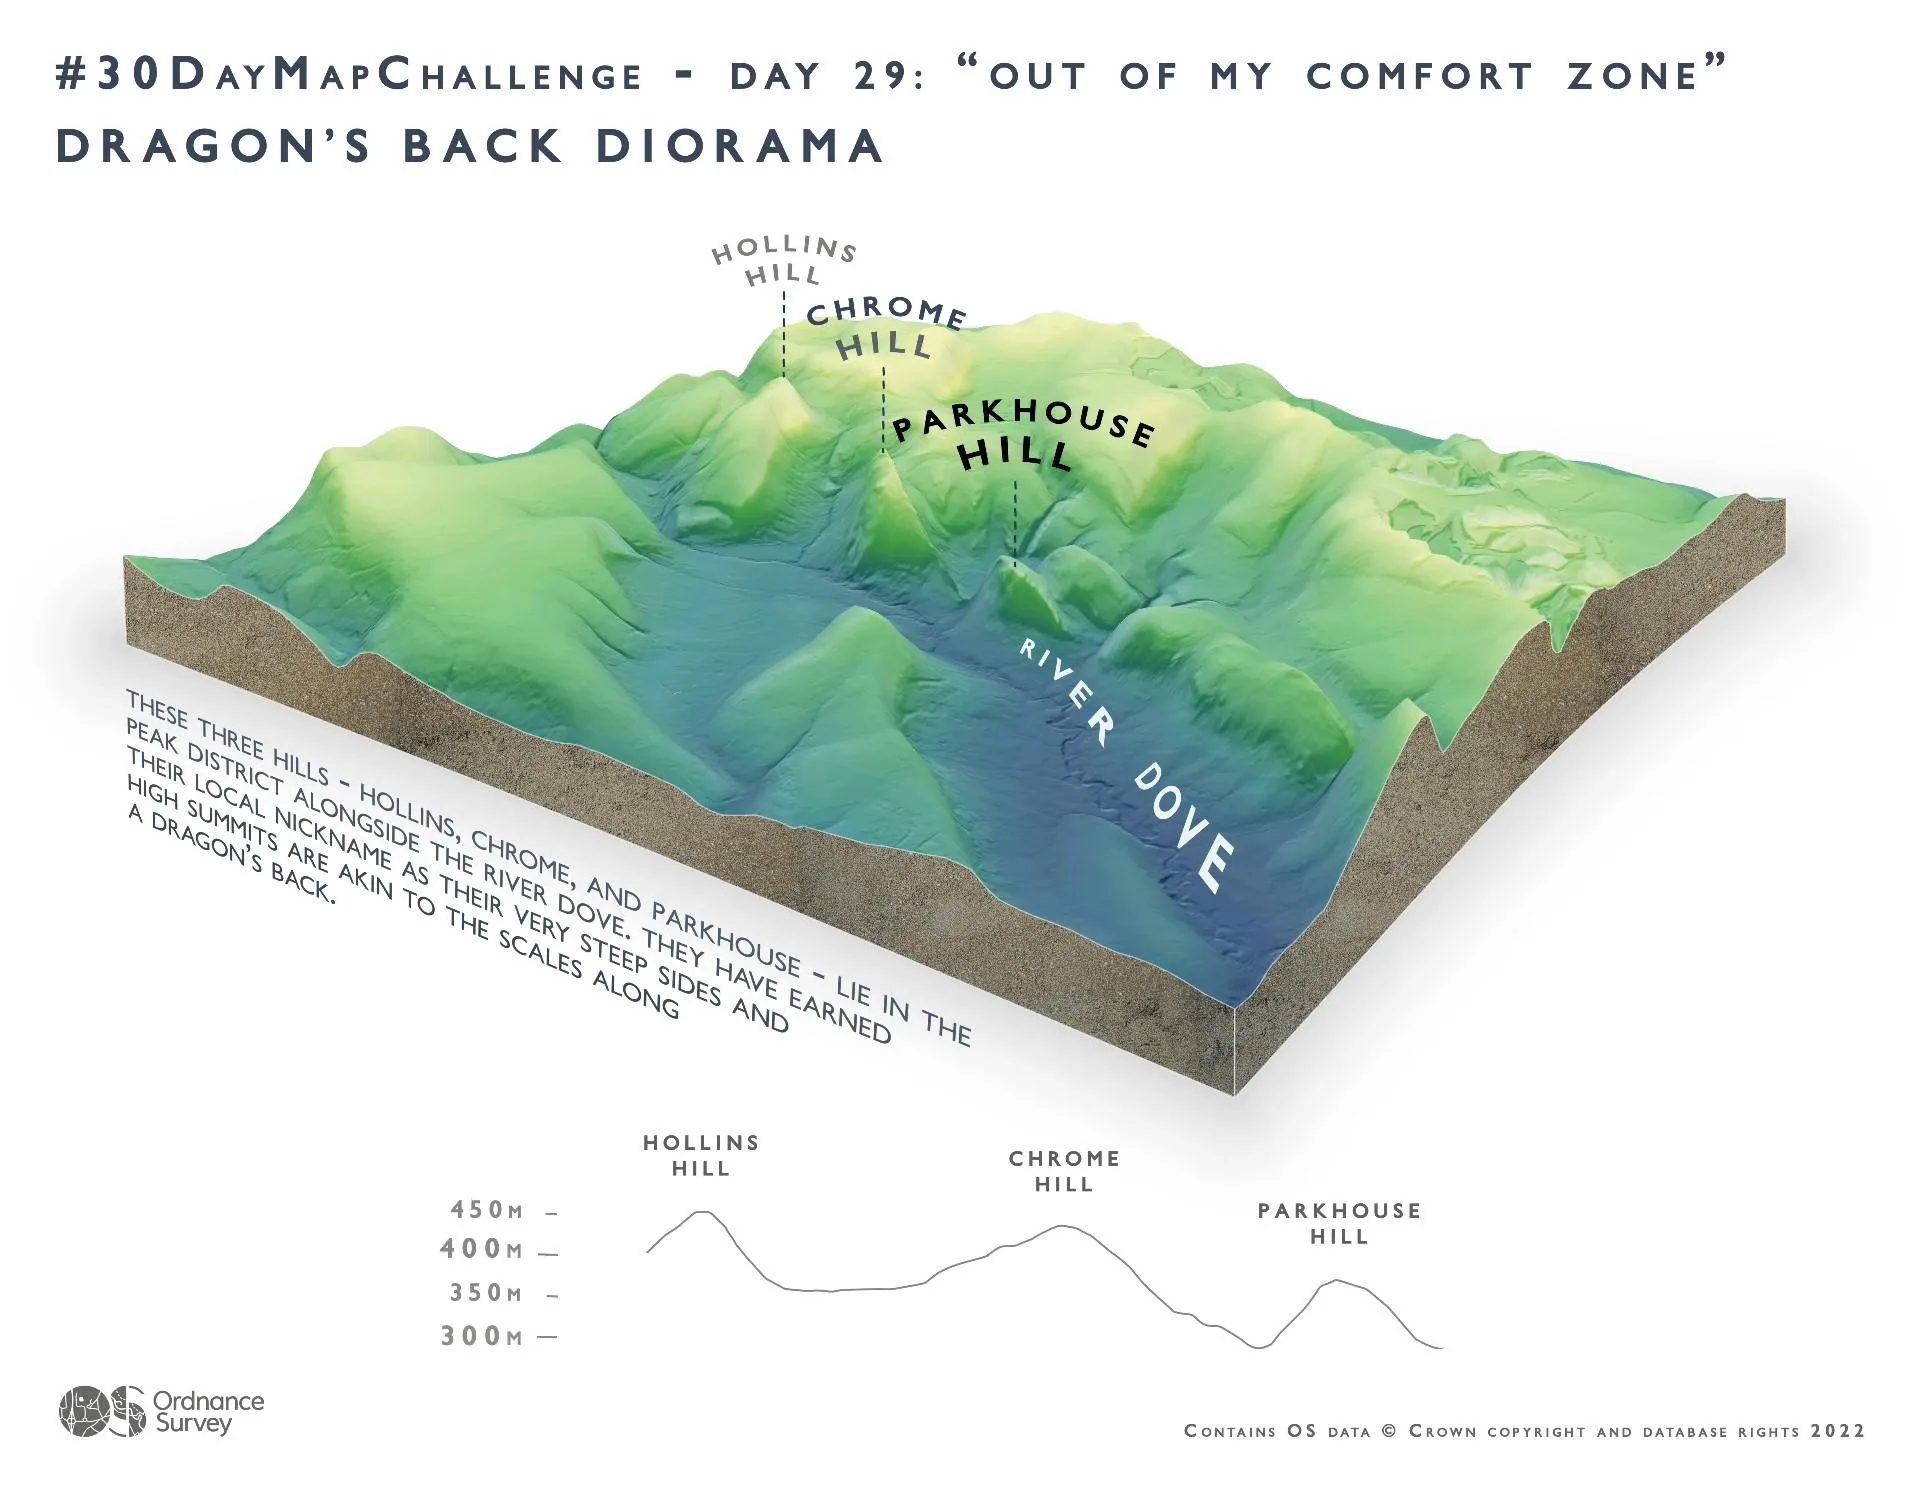
Dragon’s Back Diorama, Jessica Baker
This isn’t a mapping technique that Jess had used before, hence it being out of her comfort zone. It depicts three very sharp and steep hills in the Peak District which are brilliantly nicknamed ‘Dragon’s Back’ in this 3D diorama view, along with the elevation log if you were to walk along them.
The map was made using ArcGIS Pro and Adobe Photoshop, with help and inspiration from this excellent tutorial from John Nelson (@john_m_nelson on Twitter).
OS Data used – OS Terrain 5
Day 30 – Remix
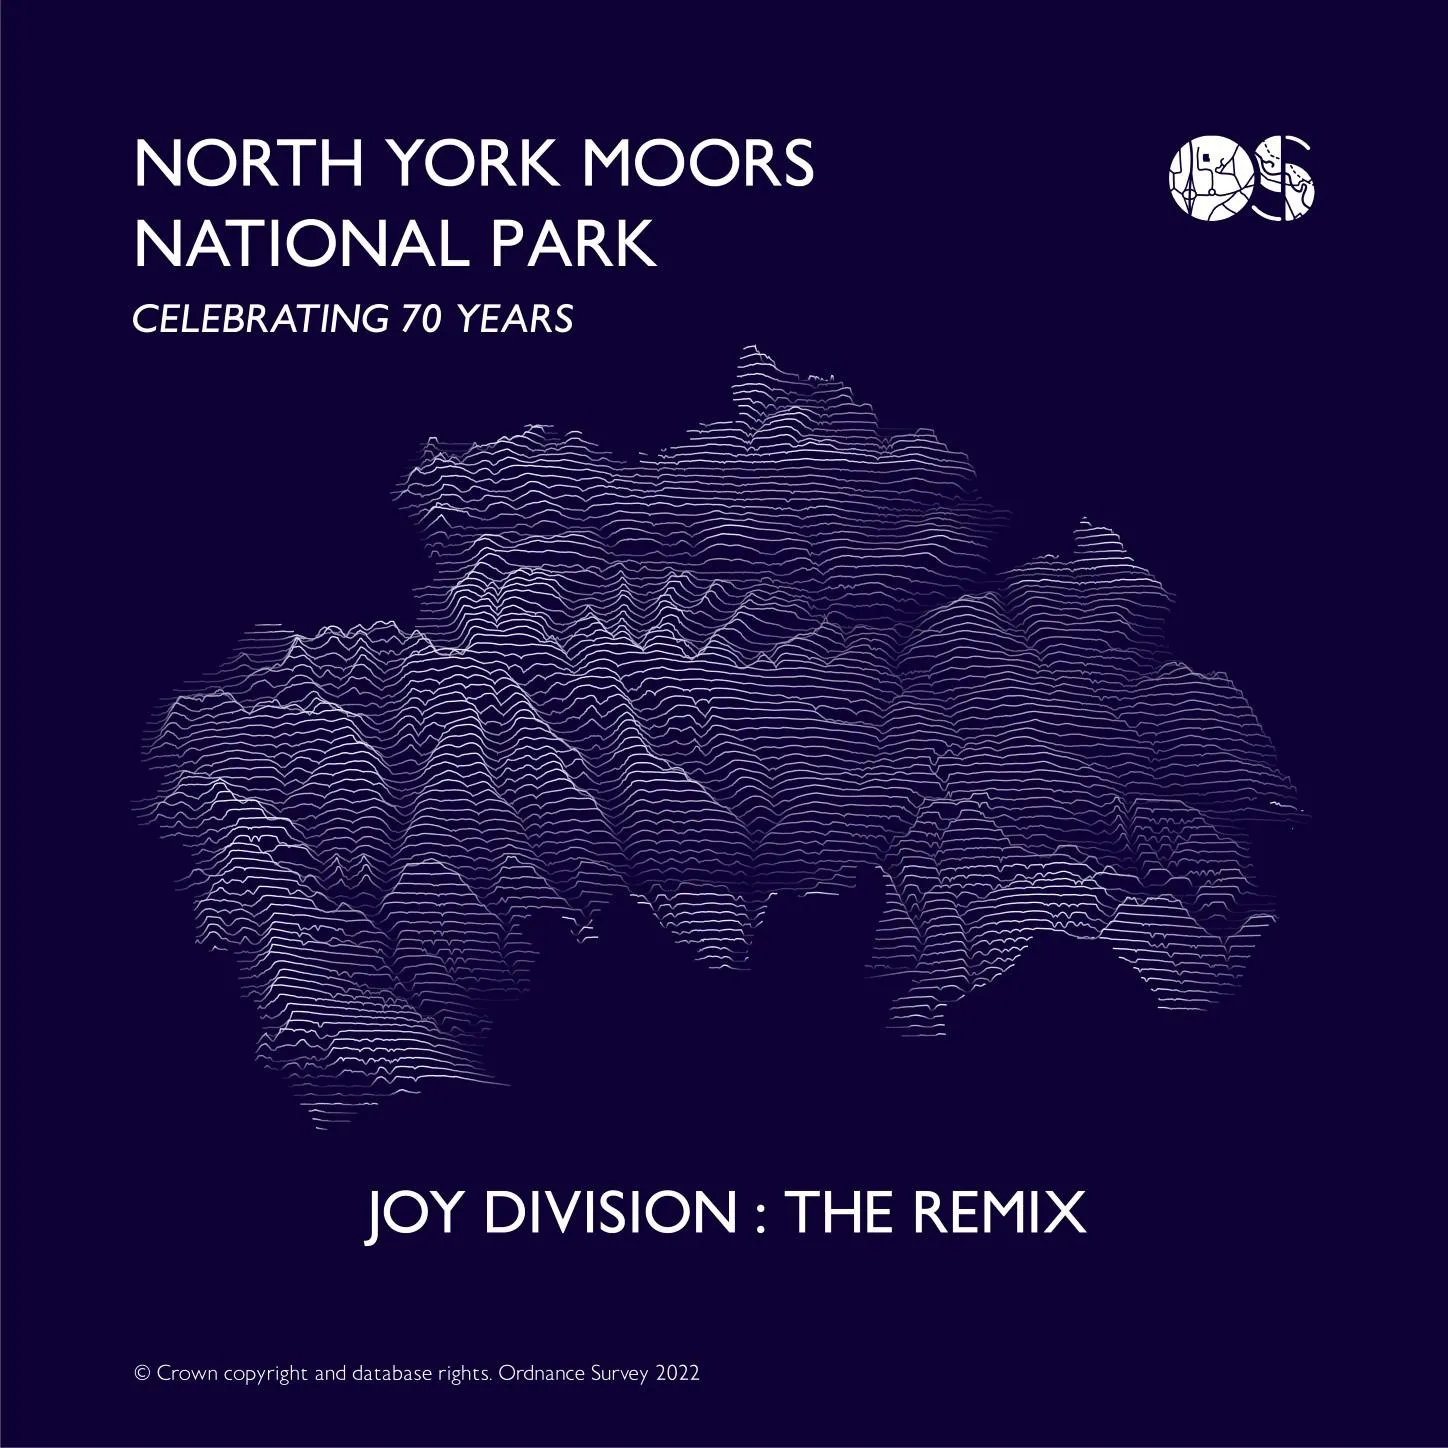
Joy Division: The Remix, Celebrating 70 years of the North York Moors National Park, Hannah Wright
In 1979, the English rock band Joy Division released their album Unknown Pleasures which featured an iconic album cover of stacked lines.
We've 'remixed' this idea using OS Terrain 5 data to show the topography of the North York Moors National Park which is celebrating its 70th anniversary this November.
OS Data used – OS Open Zoomstack, OS Terrain 5
Sharing the latest news about OS. We can license you to use OS maps in print, online and film format. For more information and resources for journalists, bloggers and media professionals, email pressoffice@os.uk or call 023 8005 5565.
Products and solutions featured in this blog
OS Open Zoomstack
Ordnance Survey's OS Open Zoomstack is an open vector basemap showing coverage of Great Britain from a national level, right down to street detail.
OS MasterMap Topography Layer
OS MasterMap Topography layer provides a map dataset of Great Britain's landscape – from roads to fields, to buildings and trees, fences, paths and more.
OS Open Zoomstack
Ordnance Survey's OS Open Zoomstack is an open vector basemap showing coverage of Great Britain from a national level, right down to street detail.
OS MasterMap Imagery Layer
Digital colour-balanced and corrected for geometric distortions (orthorectified) aerial photography for Great Britain.
1:25 000 Scale Colour Raster
1:25 000 Scale Colour Raster is the digital alternative to Ordnance Survey's OS Explorer paper map series for Great Britain.
OS MasterMap Building Height Attribute
OS MasterMap Topography Layer is a dataset showing building heights for Great Britain.
OS VectorMap District
OS VectorMap District is an open basemap to overlay and visualise your own information on.
Code-Point
Code-Point® is a postcode locator with postcode units in Great Britain and Northern Ireland.
OS Maps API
OS Maps API offers the most convenient way to add detailed OS data to your application. Benefit from unrivalled levels of detail in your GIS, web or mobile app.
Boundary-Line
Ordnance Survey's Boundary-Line is an open dataset of every administrative boundary in Great Britain.
OS Open Roads
An open dataset of the high-level view of the road network in Great Britain.
Find more blog articles
- OS
- Leisure
- Products and services
- General public
- Great Britain
- United Kingdom