How location data can help identify hard to heat homes in Britain
With rising living costs, heating homes is not always easy for every household and the term fuel poverty is now sadly heard on a regular basis.
Ordnance Survey (OS) has analysed around 23.6 million homes across Great Britain using the OS National Geographic Database (OS NGD). With over 600 million features, the OS NGD was used to identify trends and compare the physical characteristics of homes using a heat index to assess how easy they are to heat, and which households might be more vulnerable when temperatures drop.
The analysis aligns with the government’s recently announced £15 billion Warm Homes Plan, which aims to help millions of families benefit from energy-efficiency improvements, save households hundreds of pounds on their energy bills, and reduce fuel poverty by 2030.
The analysis considered:
- connected homes – properties with shared walls, such as terraced or semi‑detached properties, retain heat better than detached houses;
- period of construction (age of building) – older properties built before 1960 are less likely to have cavity walls, insulation or double glazing; and
- construction material – homes built with insulating materials lose heat more slowly.
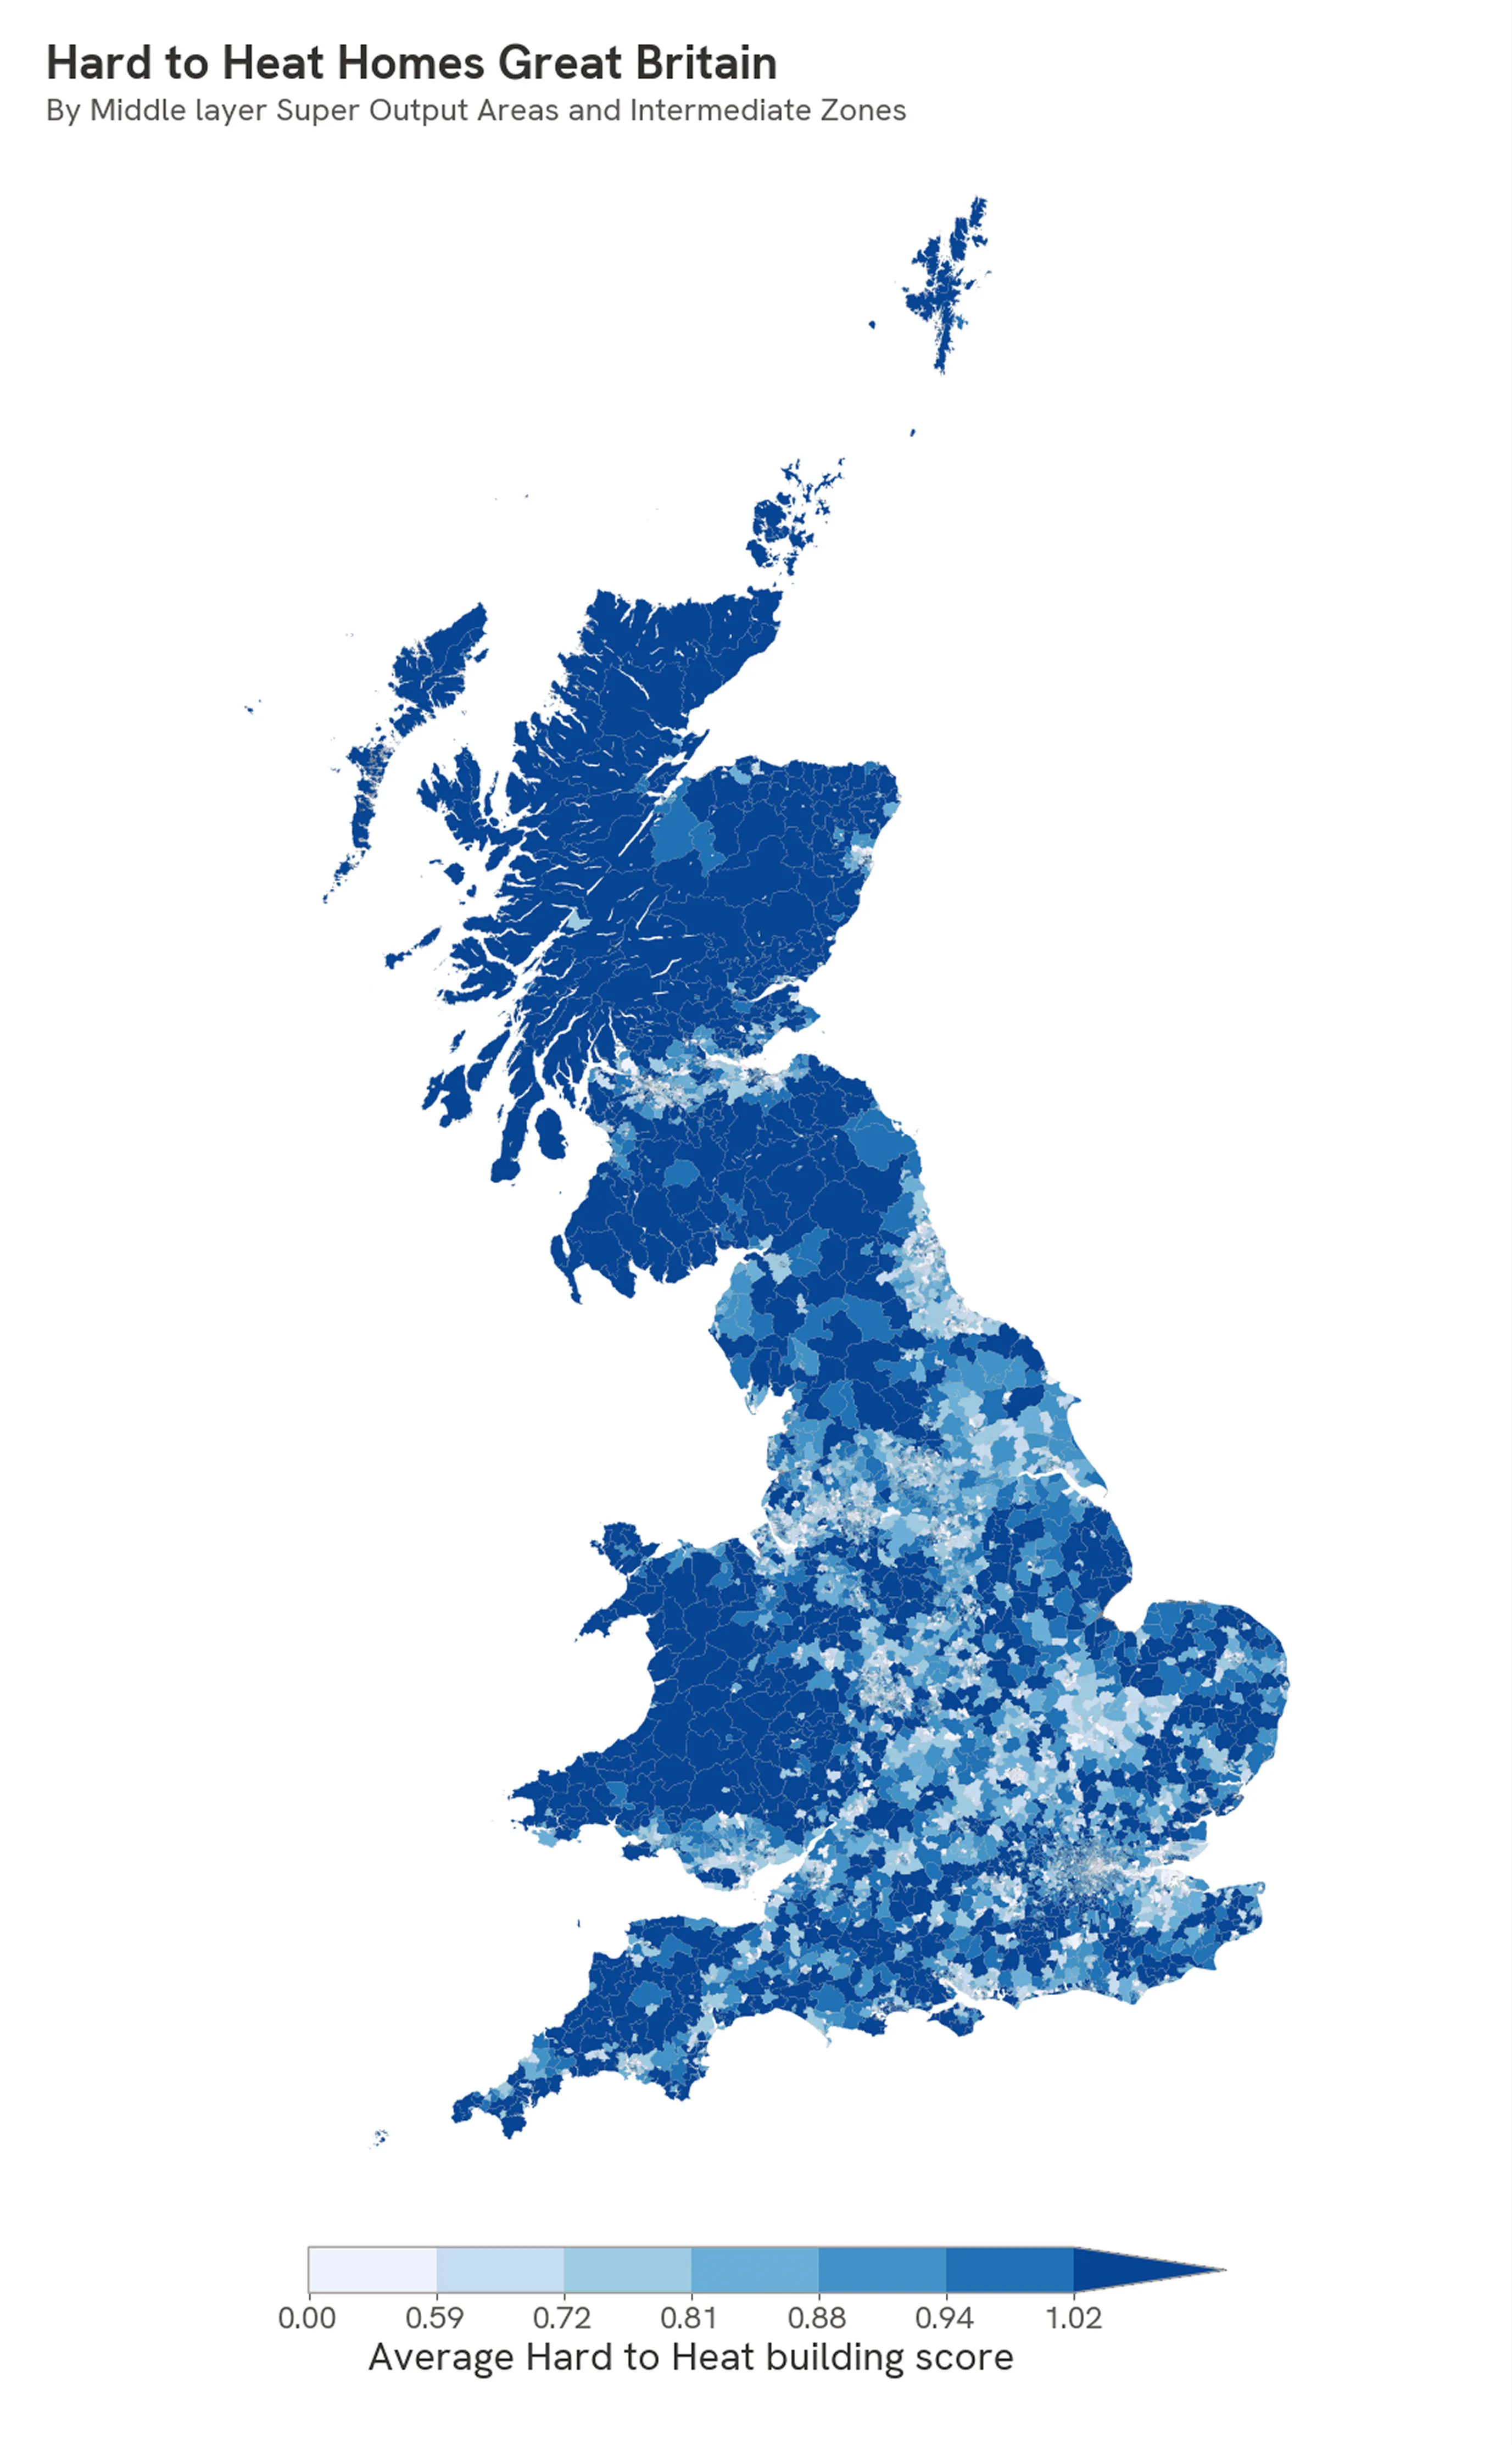
Initial analysis suggests that urban areas generally have a lower heat-loss risk. This could be influenced by a range of external factors – such as the urban heat island effect, higher ambient temperatures, and denser, often newer housing stock. In contrast, OS data indicates that coastal and remote areas tend to be harder to heat.
Local Authority Districts in northern Scotland and Wales have the highest average heat-loss scores, suggesting more homes may be harder to heat. Na h-Eileanan an Iar (Western Isles) has the highest average score of 1.30, while Stevenage in Hertfordshire has the lowest at 0.26. The scores give an indication of how hard it might be to heat up the average home in a particular Local Authority based on the three chosen building characteristics. Across Britain, most Local Authority Districts fall between 0.8 and 0.95, with around 6% scoring 1 or higher.
Additional factors also play a role. In Cornwall, for example, the predominance of traditional granite-built homes can make insulation more challenging. Across England, around 25% of residential properties are detached. Other coastal areas with a higher heat index are Wales and Scotland, which also have a higher number of detached properties - 29% in Wales and 32% in Scotland - with every wall exposed to the elements of the outdoors.
In the Scottish Highlands in particular, the higher proportion of old stone houses means heat is often lost through poor insulation, as well as ageing windows and doors. While details about granite and older stone construction are based on general characteristics and not derived from OS data, they help illustrate why certain areas face greater heat‑retention challenges.
You might expect coastal towns like Bournemouth to benefit from a milder microclimate due to protection from the Isle of Wight – an observation based on regional climate patterns. However, OS data shows homes in the area actually have a higher heat index with 59% being built before 1960s and almost 50% being standalone.
In London, boroughs such as Tower Hamlets rank among the easiest to heat, likely due to the high proportion of flats (21%) with shared walls, modern construction standards, and the lowest percentage of pre-1960 buildings (37%). In contrast, Harrow is among the hardest to heat, largely because of its high number of standalone properties and the fact that 84% of its buildings date before 1960, meaning they are more likely to have older insulation standards. Additionally, urban areas like London also experience the urban heat island effect, which could mean properties require less energy to heat.
Homes built post-1960 generally have better insulation, cavity walls, and double glazing, reducing heating bills and preventing damp and condensation. Building regulations introduced in the mid-1960s began requiring insulation, and standards have tightened significantly since then. Homes built after this period tend to feel warmer and less damp, meaning they require less energy to heat.
Among older cities, York is surprisingly easier to heat than Winchester and St Albans. By contrast, new towns such as Milton Keynes are also easier to heat, as the majority of homes (around 85%) were built after 1960, giving it the second-lowest heat index of all Local Authorities. Stevenage, the UK's first New Town, has the lowest heat index overall and the highest proportion of homes built from 1960 onwards (87%) among Local Authority Districts. Basingstoke and Deane also has a relatively low heat index, reflecting the fact that much of its development occurred after insulation standards improved.
Cambridgeshire has a lower heat index likely due to a high proportion of energy-efficient new-builds from 2011 onwards. Equally Glasgow has a higher proportion of flats and high rise buildings so we can assume with shared walls they might retain heat better.
Using OS data, it’s possible to identify south-facing rooftops suitable for solar panels, which could help households reduce energy costs. In South Cambridgeshire, 14% of residential properties already have solar panels installed. These solar panels work throughout winter, because they rely on daylight rather than temperature, although shorter daylight hours do reduce output.
When looking at the geography of Britain, hilly and mountainous regions such as the Scottish Highlands, Peak District, Lake District, and three national parks in Wales, are more exposed to harsh weather and tend to have older stone farmhouses and traditional buildings. Wales also has the oldest housing stock in the UK, largely due to industrial-era terraced housing built during the 19th century for coal and steel workers which might suggest poorer insulation.
"Understanding which homes are hardest to heat is critical for improving energy efficiency. Ordnance Survey data provides detailed insights into building age, construction materials, and location, enabling us to model heat-loss risk at scale. This data-driven approach helps pinpoint areas most vulnerable to heat loss and identify where energy-efficiency improvements would have the greatest impact. Beyond highlighting national patterns, OS data can also shed light on viable solutions such as identifying rooftops suitable for solar panels, informing town planning, and helping utility companies optimise renewable energy plans. These insights could support local authorities and homeowners in making informed decisions to keep homes warmer this winter and reduce costs."
OS already plays a central role in supporting national and local government and in enabling cost-effective approaches to delivering reliable, affordable heat. This includes a partnership with Arup, which was appointed in 2024 by the Department for Energy Security and Net Zero (DESNZ) to identify and develop heat network zones across England, underpinned by OS data.
Conclusion
Homes that are harder to heat are typically older, detached properties built from less insulating materials such as stone or timber. In contrast, homes that are easier to heat are newer, built to modern insulation standards, and often share walls with neighbouring properties.
By applying OS NGD building attributes to create a heat index, we can visualise areas where homes are most at risk of heat loss. These insights can help identify locations that would benefit from retrofitting, insulation upgrades, and other energy-efficiency improvements, helping to ensure warmer homes across Britain this winter. Understanding which homes are hardest to heat can help target energy-efficiency improvements and support households most vulnerable during cold spells.
Methodology
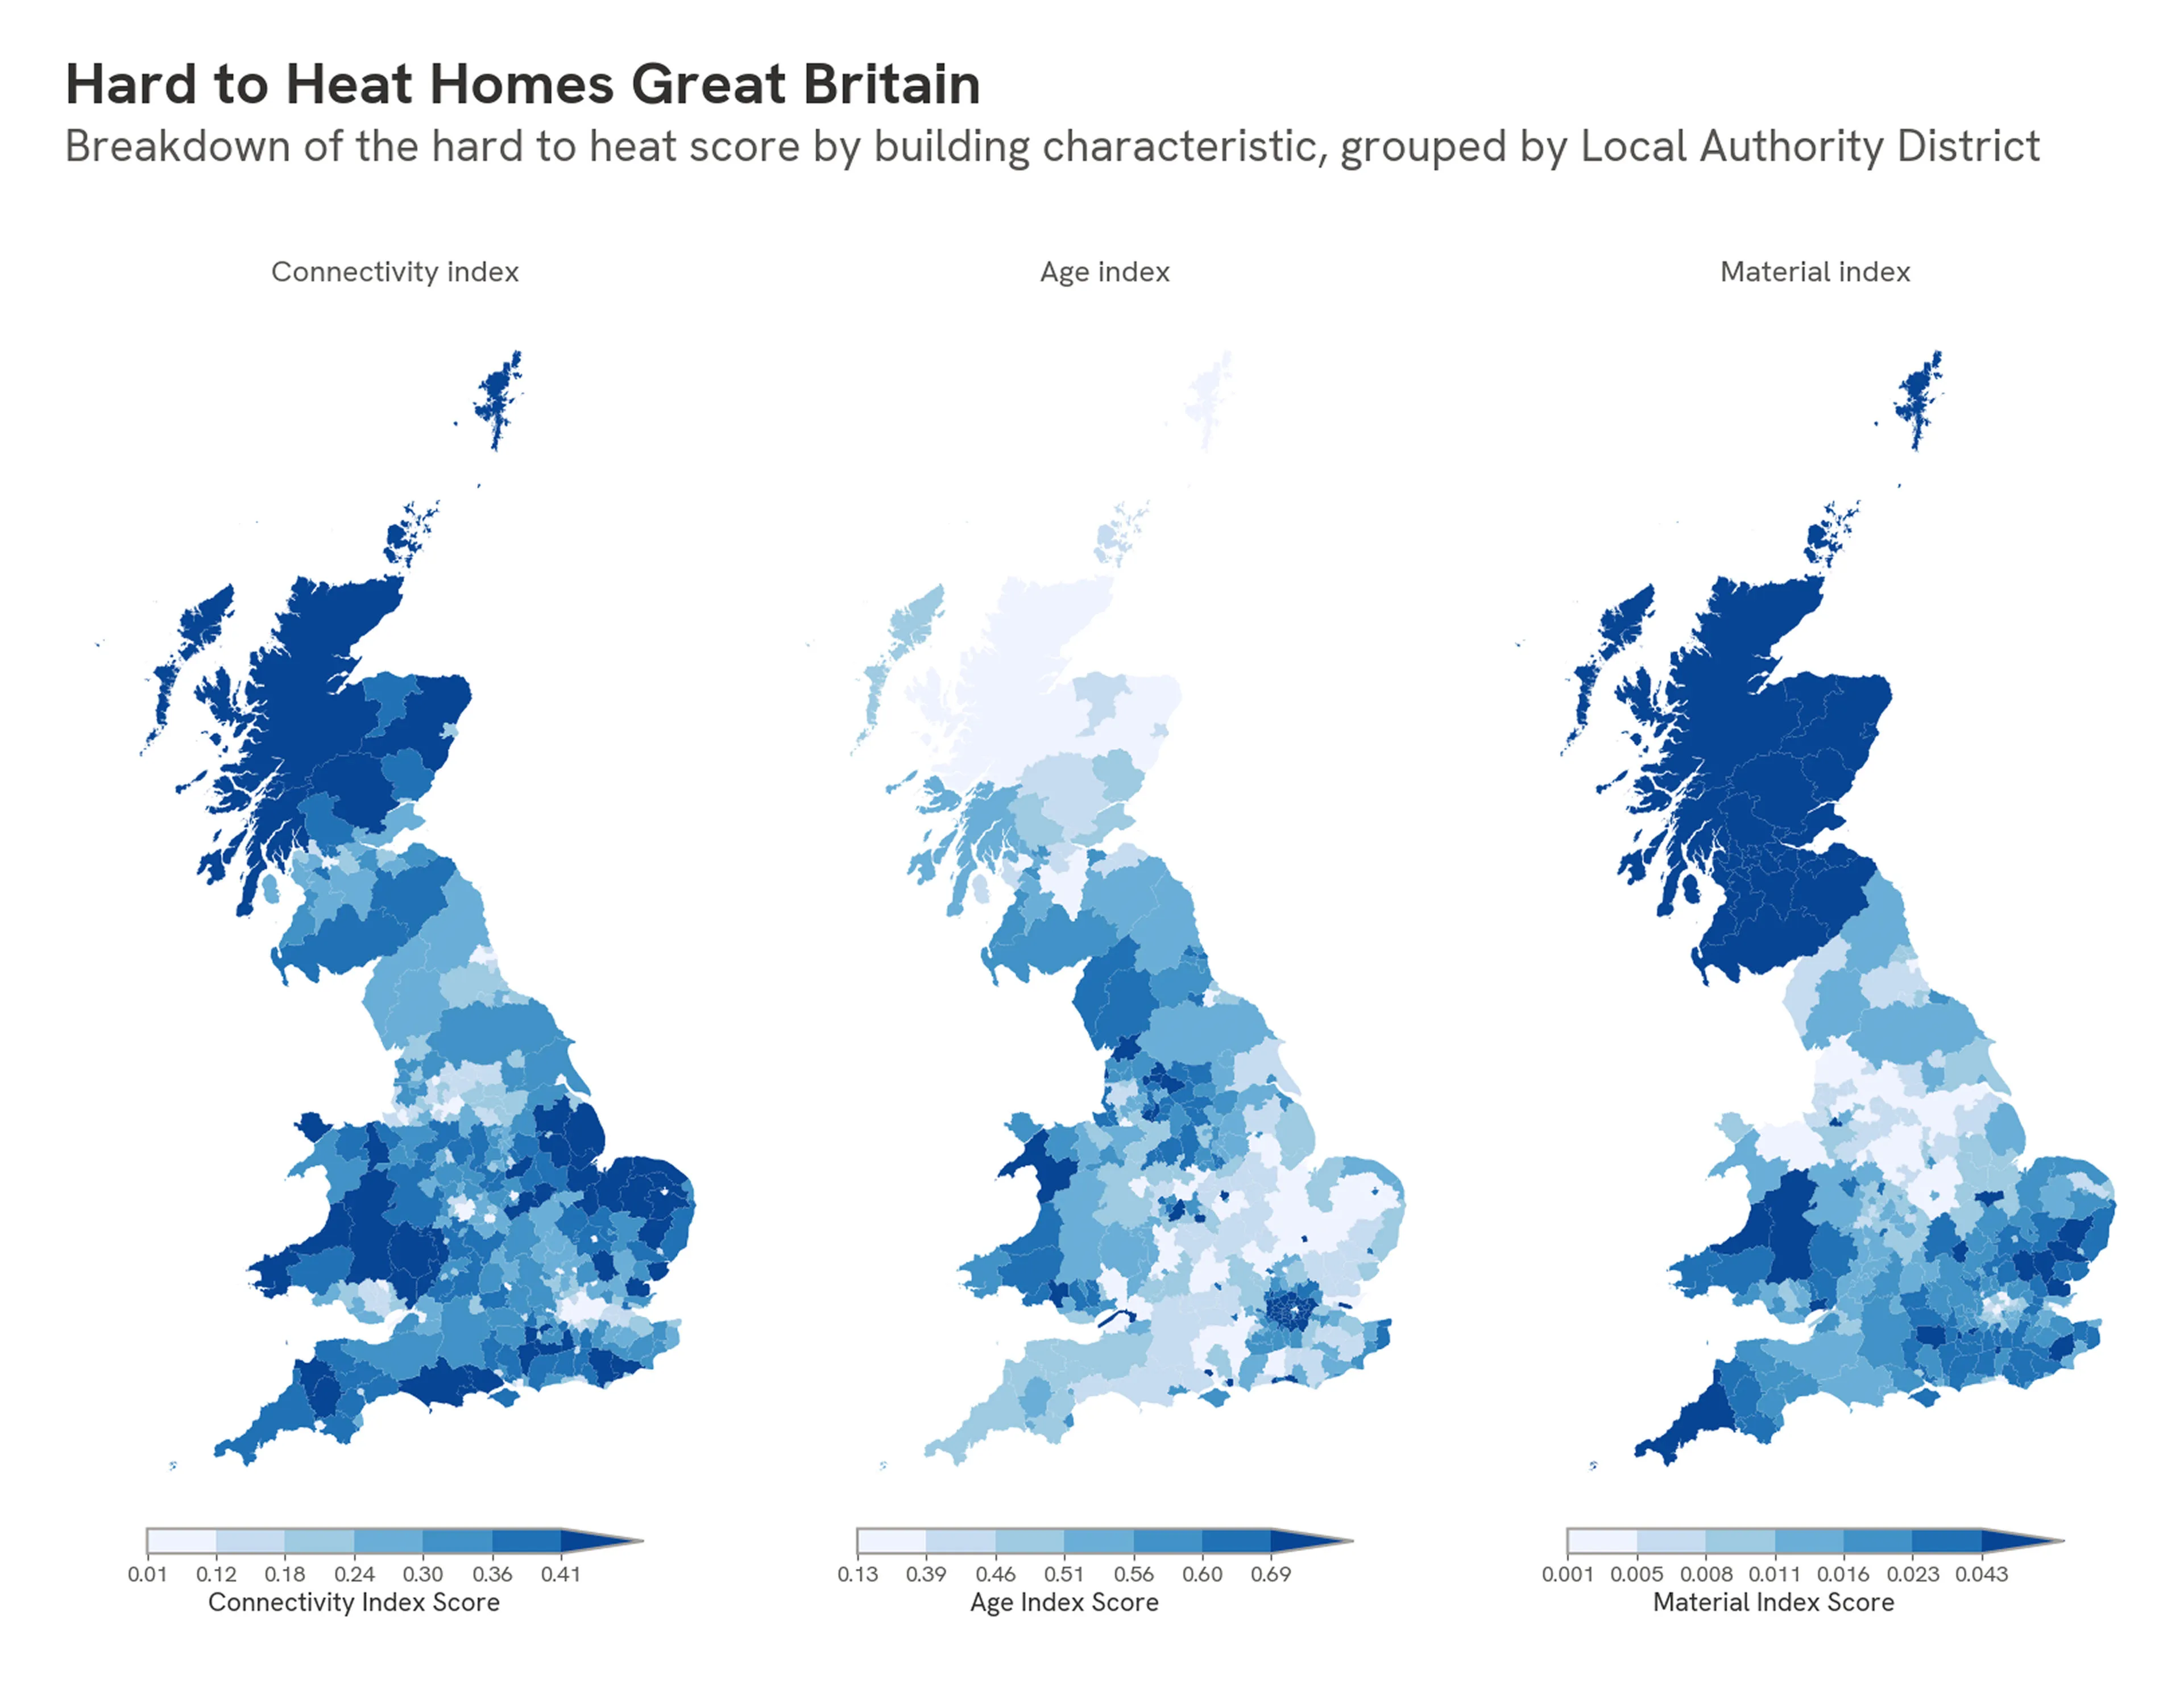
To identify ‘hard to heat homes,’ a risk index was created by giving each residential building a score based on certain physical characteristics. There are many factors which can impact a property's ability to warm up and retain heat. Here, we focus on three building characteristics, listed below, due to the following reasoning:
- Connectivity - standalone properties are less likely to retain heat compared to properties that share walls with adjacent buildings.
- Building Age Period - the time period of building construction. Older properties are less likely to have good insulation compared to newer properties, making them harder to heat.
- Construction Material - properties built with more insulating material will likely retain heat more effectivity.
A score was given for each of the three building characteristics, based their attribute values. If a property had a building attribute that was considered harder to heat, a score of 1 was given; otherwise, a score of 0 was assigned. Once assigned, the scores across the three attributes were totalled for each property resulting in an overall score. The lower the score, the easier the property it is to heat. The scores were then grouped and averaged by each Local Authority District.
|
Attribute |
Attribute Value |
Score |
|
Building Connectivity |
Standalone (not including block of flats) |
1 |
|
Block of Flats with more than 4 floors |
0 | |
|
All other buildings |
0 | |
|
Building Age Period |
Before 1960 |
1 |
|
After 1960 |
0 | |
|
Construction Material |
Mixed (Plaster And Timber), Static Caravan Or Mobile Home, Timber Or Wood |
1 |
|
All other materials |
0 |
It is also important to recognise that the physical characteristics of a building are not the only factors which influence how easy a home is to heat or indeed the ability of a household to heat a home. This index could therefore be augmented with other data which may have an impact on the ability of a household to heat a home such as Index of Multiple Deprivation statistics related to income deprivation, council tax bands, and other population characteristics.
Sharing the latest news about OS. We can license you to use OS maps in print, online and film format. For more information and resources for journalists, bloggers and media professionals, email pressoffice@os.uk or call 023 8005 5565.
Find more Insights
- Housing and land use
- Sustainability
- Land and property