New tidelines data from Ordnance Survey could strengthen coastal erosion and flood risk monitoring
Press Office
Earlier this year, the Environment Agency (EA) updated its national flood risk assessment (NaFRA), for the first time including changes in risk that may occur with climate change. It showed that around 6.3 million homes and businesses in England are in areas at risk from flooding. This equates to around one in five homes across England, which could rise to one in four homes by 2050. The EA has also updated its national coastal erosion risk map, which showed that 3,500 properties are at risk of coastal erosion by 2055.
The current OS National Geographic Database (OS NGD) Tidal Boundary line features have been automatically aggregated with the source features dissolved into continuous lines which form two new feature types within OS NGD Water – Tidal Boundary Continuous High and Tidal Boundary Continuous Low. The new dataset can also be used as overlay layers in the Tiles API, offering a clean, intuitive visual experience. They complement the NGD base layer and provide added value for contextual mapping and macro analysis.

The dataset will support environmental monitoring and regulation including:
- coastal erosion modelling - to understand impacts on people, property and infrastructure, enabling better risk management and strategic planning;
- coastal flooding modelling - to enhance preparedness and response;
- updating boundary features - to align with coastal change, enabling accurate and effective environmental monitoring and regulation, and better management of natural resources;
- climate change assessments - to identify and evaluate the impact of climate change, enabling informed decision-making and effective adaptation strategies; and
- understanding the foreshore - to identify areas that provide natural flooding defences, essential for implementing flood risk management.
"One of our core values is 'data, not opinions.' When information is missing, we seek out or collect the data needed to support sound decision-making. The OS Continuous Tidal Boundaries dataset is a great example: it removes uncertainty from our strategic monitoring programme and gives us clearer insight into intertidal extents, delivering cost savings and efficiencies for our survey contractors."
The new tidelines data is a valuable asset for those customers in environmental policy and regulation, and supporting evidence-based decisions relating to water discharge for example, whether from a regulatory or flooding perspective. Understanding where tidelines are helps in defining the intertidal zone, which provides a natural line of defence against coastal erosion and flooding. This in turn provides essential protection for coastal communities and ecosystems. Intertidal data has also been enhanced in the Land feature of the OS NGD. Adding data around obscured areas delivers a more complete and accurate coastal dataset across GB.
Lily Brown, Product Manager at Ordnance Survey, said:
“The digital master map of Britain – the OS National Geographic Database – contains trusted, accurate features that support a wide range of public and private sectors, from climate resilience and infrastructure planning to coastal management. This wealth of data delivers critical insights and by incorporating authoritative tideline data, we are enabling evidence-based decisions which will protect and monitor the nation’s evolving coastlines."

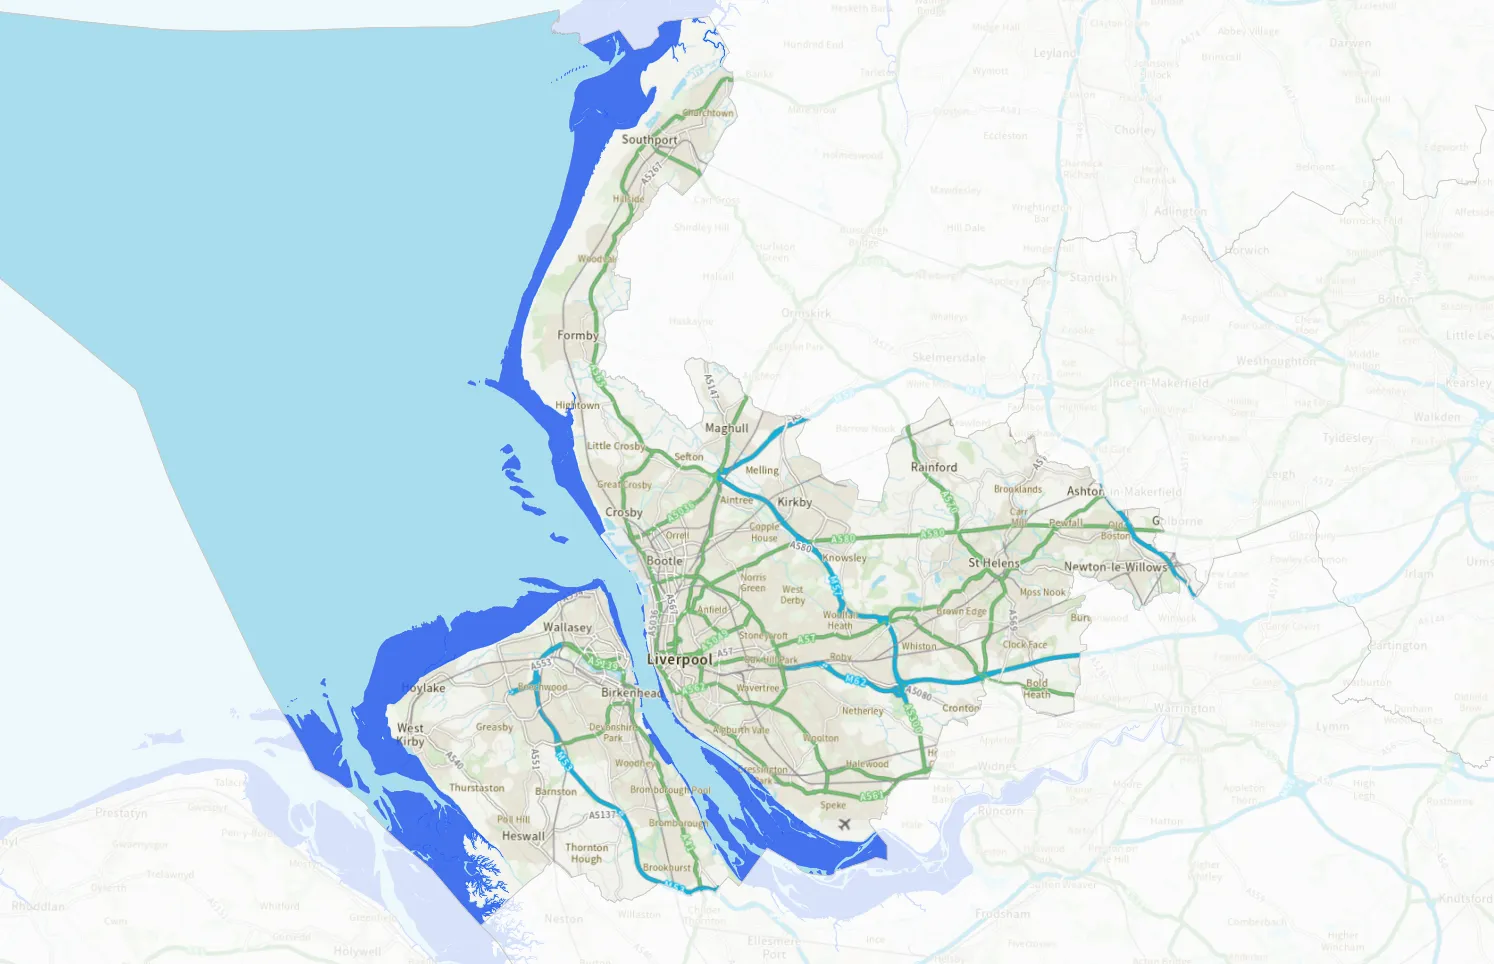
Following the release of the continuous tidelines dataset, OS has ranked all ceremonial counties in GB by their percentage change in size between high and low tide. Merseyside comes out top, much higher than the others, with a nearly 17% difference in high and low tidelines. Orkney has the second highest difference of 7%. Interestingly, counties considered to be landlocked, like Nottinghamshire and South Yorkshire, have rivers which are tidal for a long way upstream (the Trent and the Don respectively), so the changing size of the riverbanks causes a significant change in the size of the counties.
The new datasets can also be overlaid with other information to enable essential location-based insights. Combining the tidelines data with UPRNs in ceremonial counties shows that Greater London has by far the highest number of commercial and residential properties within 15 metres of high tides – around 5,500. Cornwall ranks second, with just over 3,000 properties, followed by Devon with 2,400.
The new location data has been released as part of the Public Sector Geospatial Agreement (PSGA). The PSGA is a contract between Government Digital Service, managed on behalf of the UK Government, and OS for the provision of geospatial data and services to the emergency services and wider public sector organisations.
To access all of OS’s location data visit the OS Data Hub – which provides access to the data through both APIs and downloads.
Sharing the latest news about OS. We can license you to use OS maps in print, online and film format. For more information and resources for journalists, bloggers and media professionals, email pressoffice@os.uk or call 023 8005 5565.
Explore the OS National Geographic Database
A single store of our authoritative data for Great Britain
Find more news
- Environment
- Government and public sector